Bike Network and Ridership
NYC's bike network makes streets safer and more accessible for people walking, cycling, using micromobility, riding transit, and driving vehicles. Our city's cycling network consists of bicycle facilities, or marked routes along roadways, that provide dedicated space and directional guidance for cyclists.
New York City leads the nation in design and implementation of innovative, high-quality bicycle facilities and network development strategies.
On This Page
- Network Highlights
- Cycling in the City: Ridership Trends
- Bike Counts
- Bicycle Crash Data
- Bike Share Data
Network Highlights
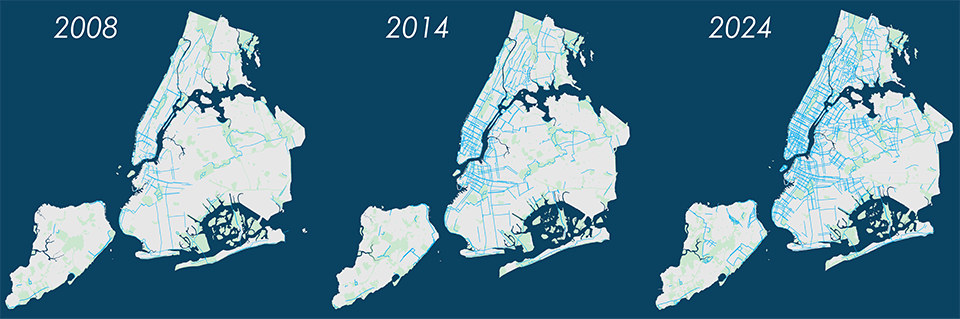
NYC DOT's goal is to accelerate the growth of safe cycling by providing a system of bicycle routes that traverse and connect all five boroughs, while also creating a dense, fine-grained network of bike lanes in communities where cycling is already a popular mode of transportation. For details regarding the planning of future routes, including our community planning initiatives, please visit NYC DOT Current Projects.
- 1,550 lane miles; North America's largest bicycle network
- 555 total protected bike lanes in the network
- 29 total protected bike lanes installed in 2024
- 99% of residents live within one mile of the bicycle network
Cycling in the City: Ridership Trends
NYC DOT uses data from local and national surveys to determine how frequently New Yorkers ride bicycles, and how that frequency changes over time. Previous versions of the Cycling in the City report are archived in NYC's Government Publications Portal
Ridership Highlights
According to the United States Decennial Census' American Community Survey (ACS):
- On a typical day, there are over 620,000 cycling trips made in New York City
According to the New York City Department of Health and Mental Hygiene (NYC DOHMH) Community Health Survey:
- 28% of adult New Yorkers (approximately 1.8 million people) ride a bike
- More than seven hundred and sixty thousand (762,000) New Yorkers ride a bike regularly
Ridership Trends Over Time
Source: United States Decennial Census American Community Survey
Bike Commuters (to Work) by Borough
This graph displays the annual growth of commuters who bike in NYC.
Estimate of Daily Cycling Trips by Year
This table displays daily bike commuters in NYC.
| Bike Commuters (to work) | Bike Commute Trips (to work) | Total Daily Cycling Trips* | Total Annual Cycling Trips (in millions) | |
|---|---|---|---|---|
| 2008 | 23,500 | 47,000 | 240,000 | 87.6 |
| 2009 | 24,400 | 48,800 | 240,000 | 87.6 |
| 2010 | 25,000 | 50,000 | 250,000 | 91.3 |
| 2011 | 26,900 | 53,800 | 270,000 | 98.6 |
| 2012 | 31,500 | 63,000 | 320,000 | 116.8 |
| 2013 | 37,600 | 75,200 | 380,000 | 138.7 |
| 2014 | 41,800 | 83,600 | 420,000 | 153.3 |
| 2015 | 45,000 | 90,000 | 450,000 | 164.3 |
| 2016 | 45,800 | 91,600 | 460,000 | 167.9 |
| 2017 | 48,800 | 97,600 | 490,000 | 178.9 |
| 2018 | 50,900 | 101,800 | 510,000 | 186.2 |
| 2019 | 52,700 | 105,400 | 530,000 | 193.5 |
| 2021 | 55,000 | 110,000 | 550,000 | 200.8 |
| 2022 | 61,200 | 122,400 | 610,000 | 222.7 |
| 2023 | 61,600 | 123,200 | 620,000 | 226.3 |
*Multiplier applied to ACS Journey to Work
Data Types, Sources, and Limitations (pdf)
Bike Counts
These bike counts represent the number of cyclists riding past a location monitored by NYC DOT.
Automated Bike Counters
NYC DOT uses automated bike counters to continuously count bicycle activity at key network points in the city. These counters provide insight into daily, seasonal, and weather trends and are located along protected bike lanes and paths. Open the NYC DOT Automated Bike Counters map in a new tab Bicycle Counts on NYC Open Data Bicycle Counter on NYC Open Data
East River Bridges Counts
From 1980-2013, NYC DOT conducted periodic manual East River bridge bike counts. In 2014, NYC DOT installed automated counters collecting continuous 24-hour data, averaged monthly. 1980-2024 East River Bridge 24-Hour Cyclist Counts April 2025 East River Bridge 24-Hour Cyclist Counts May 2025 East River Bridge 24-Hour Cyclist Counts June 2025 East River Bridge 24-Hour Cyclist Counts July 2025 East River Bridge 24-Hour Cyclist Counts
Midtown Counts
NYC DOT counts cyclists entering and leaving the Manhattan core at 50 Street along the avenues and Hudson River Greenway. This data was first recorded in 1980, and has been collected annually since 1985, and three times per year—typically in May, July, and September—since 2007. Midtown Bike Counts (pdf) Midtown Bicycle Counts on NYC Open Data
Uptown Counts
NYC DOT periodically counts cyclists at 86 Street in Manhattan along the avenues, in Central Park, and on the greenways. This data was first recorded in 2007 and was subsequently collected in October between 2011 and 2018.Uptown Bike Counts (pdf) Uptown Bicycle Counts on NYC Open Data
Bicycle Crash Data
NYC DOT compiles the total number of bicycle crashes reported by city agencies. The Bicycle Crash Data report contains information on crashes involving only bicycles, between bicycles and motorized vehicles, and between bicycles and pedestrians. Bicycle Crash Data Report Previous Bicycle Crash Data reports are archived in the Government Publications portal
Bike Share Data
Bike share provides an additional option to get around the city using publicly available bikes. Citi Bike is New York City’s bike share system. Bike share data can be found and downloaded via NYC Open Data. Citi Bike System Data Citi Bike stations status feed (json) Citi Bike Monthly Operating Reports
Quarterly Bike Share Usage Data Report
This report compiles the usage data on bike share trips, including duration, start and end times, bike numbers, and membership type for the stated quarter. Bike Share Usage Data Report – Quarter 2, 2025 Bike Share Usage Data Report – Quarter 1, 2025 Bike Share Usage Data Report – Quarter 4, 2024 Bike Share Usage Data Report – Quarter 3, 2024 Previous versions of the Bike Share Usage Data report are archived in the Government’s Publications Portal
Bike Share Financial Data Reports
Pursuant to Administrative Code Section 19-194 enacted by Local Law 100 of 2015, NYC DOT is required to report on revenues generated by the bike share program. These annual reports include information on revenues including deficits or profits and the amount of revenue shared with the City. Bike Share Financial Data Report 2023 (pdf) Bike Share Financial Data Report 2022 (pdf) Bike Share Financial Data Report 2021 (pdf)