


PASSPort Vendor Reports
Learn how to access Vendor Reports in PASSPort, including reports related to financials, contracts, and solicitation responses (RFx). These reports allow you to easily track activity, monitor budgets, and download the data you need. The Vendor Reports display vendor data, and both Vendors and City Agencies can view them in PASSPort.
- How It Works
- Common Features
- Vendor Reports
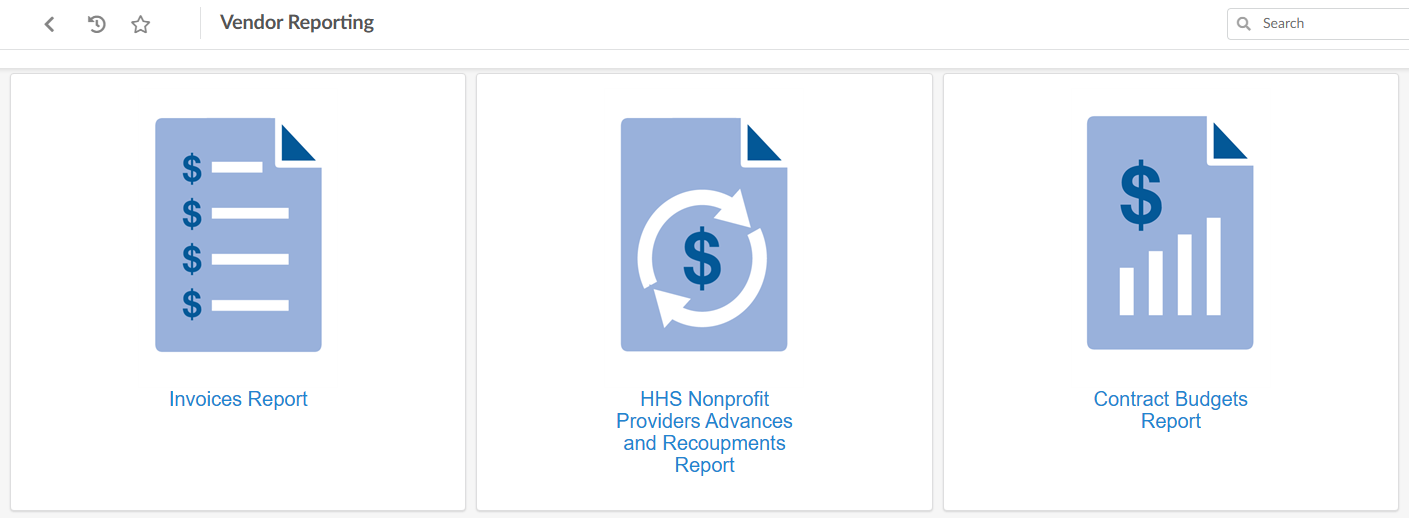
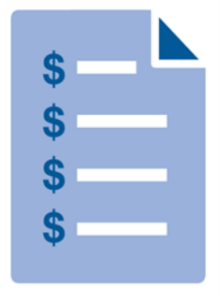
- Invoices Report
- HHS Nonprofit Providers Advances and Recoupments Report
- Contract Budget Report
- Contract Registration Report (Coming Soon!)
- Subcontractor Summary Report (Coming Soon!)
- Bid/Proposal Summary Report (Coming Soon!)
- Back to top
How It Works
You can access the Vendor Reporting tab in the PASSPort top navigation menu (available on every page in PASSPort).

The following reports can be accessed from the Vendor Reporting tab:
- Invoices Report
- HHS Nonprofit Providers Advances and Recoupments Report
- Contract Budgets Report
- Contract Registrations Report (Coming Soon!)
- Subcontractors Report (Coming Soon!)
- Bid/Proposals Report (Coming Soon!)
All reports share a common layout and features:
- Summary Tiles: Key figures at the top of each report (e.g., total invoiced amount, total advanced amount, etc.)
- Charts Visual breakdowns of data by month, program, status, etc.
- Detailed Pivot Tables: A dynamic table at the bottom of the page that allows you to see details by agency, contract, fiscal year, and more.
You can customize each report using filters and export your data into PDF, Word, and Excel format.
Common Features
Each report can be customized to meet your needs. The following features can be found in all reports.
Filters Pane
Use the filters pane to control what information appears in the report.
All reports include a Filters pane on the left side of the screen. Some filters are common across reports, while other filters are specific to the report you are viewing. Common filters include:
- Fiscal Year
- Contract
- Program
- Agency
- Limit Agency Perimeter**
- Status
- Vendor**
- Industry
**This filter limits report data to your organization only and can only be edited by City Agencies.
Add filters by either typing in the field directly or clicking See All from the drop-down menu to select from the full list of options.
If a filter already displays, click the x to remove it or click the exclude icon (), which will display all data except the excluded filter.


Pivot Table Filters
All Detail Reports (or Pivot Tables) can be customized using Dimensions. These are categories used to break down the data (e.g., Contract, Agency, Contract Status, Program, Industry, and more).
Click the + icon to add additional columns (i.e., dimensions) to the table.
Click the x icon to the left of an existing column to remove it.

Each column can be further broken down. Click the drop-down icon on a dimension header to view a menu with the following options:
Collapse all: Compresses the table to hide the detailed breakdown and shows only the totals for the selected header.
Expand all: Restores the table to its full view.
Show Total: Adds an additional “Total” row or column alongside the detailed breakdown. Use this to see a clearer view of aggregated amounts for the selected header.
Show Others: Adds an additional row or column to capture remaining values not listed within the selected header.
Sort: Reorders data within the table in either ascending or descending order based on the selection made.
Filter: Limits the data shown based on the indicator and condition selected. Filter conditions include =, >, >=, <, <=.
Scope: Limits the data shown to the top or bottom values within the selected header. The scope is defined based on either count (e.g., Top 5) or percentage (e.g., Bottom 5%) and the indicator for which the scope should be applied.

In the right-most columns of all Pivot Tables are the Indicators. These are the numeric values being measured or calculated (e.g., Invoice Amount, Invoice Cycle Time, etc.)
To sort the indicator headers, click the drop-down icon and select from the Sort menu. There are three options:
- Order: Arranges the columns based on the original (default) order of the indicators.
- Indicator Label: Arranges the columns in alphabetical order by name.
- Indicator Value: Arranges the columns based on the total aggregated value of each indicator.
All options can be sorted in ascending or descending order.

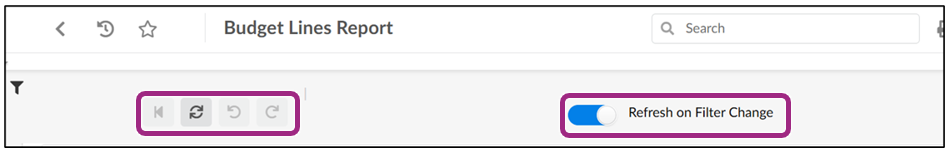
Action Buttons
Action buttons appear at the top of every report.
| Action Buttons | Description |
|---|---|
| Undo All () | Returns the report to a state before changes were made. |
| Refresh Data () | Updates existing report data when a filter is changed, and Auto Refresh is not enabled. |
| Undo () | Reverses the most recent action. |
| Redo () | Repeats the most recent undone action. |
| Auto Refresh () | When toggled on, the Auto Refresh updates the report whenever a filter is applied or changed. |
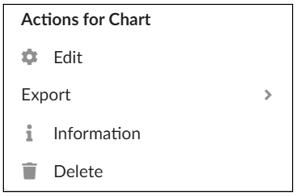
Action Menu
An action menu appears on each chart or table when right-clicked.
The Actions for Chart menu includes four options:
- Edit: Brings up the Manage Chart Properties window.
Note: For agencies only. - Export: Download that specific chart or table in Excel, PDF, or Word format.
Note: The file saves to your computer under the name “analysis”. - Information: Displays the date and time the chart was last refreshed/updated.
- Delete: Removes the selected tile from the report. Action is undone when the user’s
session is
completed, and the report is closed.
Note: For agencies only.
Vendor Reports
There are six reports available in PASSPort’s Vendor Reporting tab. The table below provides a brief description of each report. Click each report title for more details.
| Vendor Reports | |
|---|---|
| Invoices Report | Shows a summary of invoices submitted through PASSPort to date, including total invoiced amounts, disbursed payment amounts, agency approval cycle times, invoice amounts by agency program area (division/bureau), and invoice status. You can filter by contract and/or fiscal year and use the Detailed Report section to see individual budgets and invoices. |
| HHS Nonprofit Providers Advances and Recoupments Report | Shows City-funded advance and recoupment data for providers. Data is grouped by month and status. You can filter by agency, contract, and fiscal year. |
| Contract Budgets Report | Shows budget information by fiscal year, including total budget, paid amount, and remaining balance. You can also see a Budget Utilization chart showing when invoices and advances are paid. |
| Contract Registration Report | Shows how many contracts are registered, their dollar amounts, and details on unregistered contracts and amendments. You can also see expired contracts, total amounts paid, and contract counts by contract procurement method. |
| Subcontractors Report | Shows how many contracts have subcontractors, their subcontract amount, and payment status. You can also monitor subcontractor approval and modification activity. |
| Bid/Proposals Report | Shows proposals and the associated RFx activity based on the filters you select. |
Invoices Report
The Invoices Report shows a summary of invoices submitted through PASSPort to date, including total invoiced amounts, disbursed payment amounts, agency approval cycle times, invoice amounts by Agency program area (division/bureau), and invoice status. You can filter by contract and/or fiscal year and use the Detailed Report section to see individual budgets and invoices.
| Summary Tiles | |
|---|---|
| Total Invoiced Amount (USD) | This is the total sum of all net invoiced amounts in USD. Note: Excludes invoices in Draft and Canceled status. |
| Total Disbursed Amount (USD) | This shows the portion of the total invoiced amount that has been paid to the vendor. |
| Disbursed Percentage (%) | This is the Total Disbursed Amount displayed as a percentage instead of a dollar value. |
| Total Uninvoiced Amount (USD) | This includes amounts not yet paid to the vendor, amounts not invoiced, payment adjustments not released, and advanced amounts not yet recouped. |
| Charts | |
|---|---|
| Program-Level Invoices and Recoupments | Shows the top 20 programs with the highest total invoice amounts. It compares the total amount invoiced against the total amount recouped for each program. For exact figures, hover over the bars. You can also hide the invoiced or recouped bars to focus on a single metric. |
| Invoice Count by Age | Tracks all pending invoices by how long they've been
waiting since submission. Invoices are grouped by age range
(e.g., 0-7 days, 8-15 days, etc.). Hover over a bar to see the
exact count of invoices in that age group. Note: Excludes invoices in Canceled or Disbursed status. |
| Invoice Cycle Time (Days) by Status | Shows the average number of days an invoice spends
waiting at each pending status. Hover over a bar to see the
exact number of days. Note: Excludes invoices in Canceled or Disbursed status. |
| Invoice Count by Status | Shows the current number of invoices sitting at each invoice status (e.g., Draft, Invoice Approval in Progress, etc.). Hover over a bar to see the exact count of invoices in that status. |
| Detail Reports (Pivot Tables) | |
|---|---|
| Invoiced Amount by Budget | Provides a detailed breakdown of invoice data by purchase order (PO). It's designed to help you track the financial status of your contract budgets. Important columns to note include the budgeted amount, invoiced amount, disbursed amount, and recouped amount, as well as the remaining amount. It also tracks the number of invoices for that PO that have been pending for over 30 days. You can add or remove columns to include information like Program or Industry. |
| Detailed Invoice Report | Provides a detailed breakdown of every individual invoice. It's designed to help you track specific invoice journeys and processing times. Important columns to note include the invoice ID, invoice status, invoiced amount, and the disbursed amount. It also shows the Cycle Time (i.e., the total number of days the invoice took to move from Draft to Disbursed). You can add or remove columns to include information like Program or Industry. |
HHS Nonprofit Providers Advances and Recoupments Report
The Advances and Recoupments Report shows City-funded advance and recoupment data for providers. Data is grouped by month and status. You can filter by agency, contract, and fiscal year.
| Summary Tiles | |
|---|---|
| Total Advanced Amount (USD) | This is the total amount of funds advanced (paid upfront)
to vendors with active contracts. Note: Excludes advances in Canceled status. |
| Total Recouped Amount (USD) | This shows the amount of those advanced funds that have already been paid back to the agency. |
| Total Unrecouped Amount (USD) | This is the amount of advanced funds that has not yet been paid back to the agency. |
| Charts | |
|---|---|
| Advance Count by Status | Shows the number of advances sitting at each status (e.g., Draft, Approval in Progress, etc.) Hover over each bar to view the exact count of advances in that status. |
| Detail Reports (Pivot Tables) | |
|---|---|
| Detailed Advance Report | Provides a detailed breakdown of your advance and recoupment data by purchase order (PO). It’s designed to help you track how much of your advanced funds have been paid back. Important columns to note include the advanced amount, the recouped amount, and the remaining recoupment amount for each PO. You can add or remove columns to include information like Program or Industry. |
| Detail Report by Advance Creation Date | Provides a detailed breakdown of your advance and recoupment data by creation date. It’s designed to help you track your advance activity by month and fiscal year. For example, how many advances were created, the amount issued, and whether any of those advances have been fully or partially recouped. Important columns to note include the advanced amount, the recouped amount, and the remaining recoupment amount. You can add or remove columns to include information like Program or Industry. |
Contract Budgets Report
The Contract Budgets Report shows budget information for each fiscal year, including total budget, paid amount, and remaining balance. You can also see a Budget Utilization chart showing when invoices and advances are paid.
| Summary Tiles | |
|---|---|
| Total Budgeted Amount (USD) | This is the total available budget amount across all your active contract budgets. |
| Total Paid Amount (USD) | Includes the invoiced amount paid to the vendor AND the total advanced amount paid back to the agency across all contract budgets. |
| Total Remaining Budget (USD) | This is the portion of the budget that has not yet been paid to the vendor. |
| Charts | |
|---|---|
| Budget Utilization | Tracks monthly financial activity. It focuses on the:
Note: Months are organized from July to Post June. The Post June category includes invoices and advances created, submitted, or disbursed after the fiscal year ends, but that still belong to the past fiscal year. For exact amounts, hover over a data point. You can hide the Invoiced, Advanced, or Disbursed lines to focus on specific trends. |
| Detail Reports (Pivot Tables) | |
|---|---|
| Detailed Contract Budgets Report | Provides a detailed breakdown of all contract budgets. It's designed to track the utilization of the total funding allocated for your contracts. Important columns to note include the budgeted amount, invoiced amount, advanced amount, paid amount, and the remaining budgeted amount. You can add or remove columns to include information like Program or Industry. |
| Detailed Sub-Budget Report | Provides a detailed breakdown of all sub-budgets. It's designed to track funds for different lines of service or expense categories. Important columns to note include the sub-budget, budgeted amount, sub-budget budgeted amount, and the sub-budget remaining amount. You can add or remove columns to include information like Program or Industry. |
Last updated: December 23, 2025