Components of Population Change
New York City, 2010 to 2020
Migration is a major driver of population change in New York City, significantly influencing the city’s economy and the social fabric of its neighborhoods. Large and ongoing movements of people into the five boroughs—from other parts of the United States and countries around the world—fuel the city’s vitality. These inflows, along with outflows from the city, generate a population “churn” that continually reshapes the city’s demographic makeup.
New York City has a remarkably dynamic population, reflected in the hundreds of thousands of people moving to the city from across the United States and around the globe; at the same time hundreds of thousands leave each year for domestic and international destinations. This ongoing cycle of population turnover continually refreshes the city’s demographics, contributing to its rich diversity. Since the middle of the 20th century, more people have typically moved out of New York City each year than have moved in. But domestic migration patterns differ from international flows. More people move out of New York City to domestic locations than move in from the rest of the nation, resulting in net domestic outflows; meanwhile, more people move into New York City from places abroad than emigrate to places outside the United States, resulting in net international inflows. The net effect of both international and domestic flows is net migration losses, or more people moving out than in. New York’s population gains have come through natural increase—the excess of births over deaths—offsetting migration losses, a long-standing pattern for the city. (Box 7.2 provides a more expansive explanation of these components of population change.) Shifts in migration patterns, both domestic and international, have determined the volume of population growth over the past several decades, as well as the relatively short periods of losses.
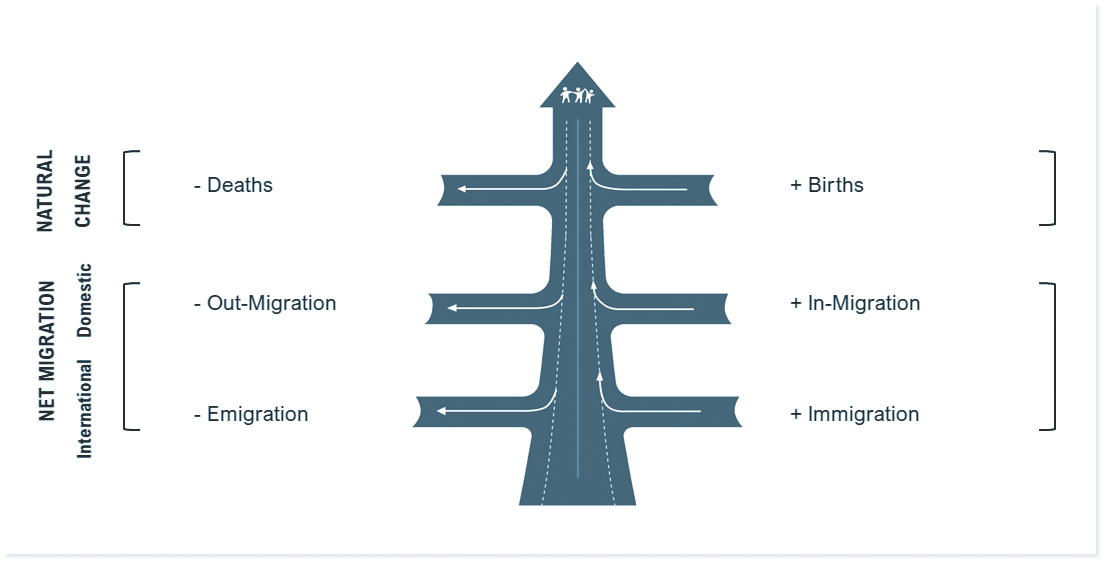
Population growth or decline over any period can be explained by two population processes: net migration and natural change. Together, these comprise the components of population change (Figure 7.1).
Net migration is the balance of those moving into and out of a location, both domestically and internationally. Net migration losses, or net outflows, refer to more people moving out than in. Net migration gains, or net inflows, refer to more people moving in than out. Net migration is the combined result of net domestic migration (the balance of flows within the United States) and net international migration (net exchanges with places abroad).
Natural change is the balance of births and deaths. Natural increase refers to more births than deaths, and natural decrease refers to more deaths than births.
When the sum of net migration and natural change is positive, the population grows; when it is negative, the population declines.
Source: U.S. Census Bureau, 2010 to 2019 American Community Survey—Summary File, Population Estimates Program (Vintage 2020); U.S. Centers for Disease Control and Prevention, National Center for Health Statistics; New York City Department of Health and Mental Hygiene; Population Division—New York City Department of City Planning

The components of population change for the decade 2010 to 2020 (Figure 7.2) reflect these long-established patterns. As noted above, population change is a function of two primary demographic components: natural change (the balance of births and deaths) and net migration (the balance of people entering and leaving the city). As noted earlier, net migration can also be thought of as the sum of net domestic and net international flows. Over the course of the decade, net domestic outflows from the city totaled 564,000, a result of 2.21 million city residents leaving for the 50 states, and 1.64 million people moving to the city from the rest of the nation. At the same time, net international inflows to the city totaled 513,000, with 928,000 immigrants moving to the city from outside the United States, and 415,000 city residents leaving the country.1,2 The net result of domestic and international flows was a migration loss of 51,000. While relatively small, it masked a remarkable volume of movement into and out of the city. With domestic and international flows combined, approximately 2.57 million people moved to New York City, while roughly 2.62 million people moved out, equivalent to nearly the entire population of Chicago entering and leaving New York City over the decade. On an annual basis, this is equivalent to inflows and outflows averaging more than one quarter-million people each year, or roughly the population of Boise, ID or St. Petersburg, FL moving in and out of the city each year.
Net migration losses of 51,000 during the decade 2010 to 2020 were more than offset by natural increase of 613,000 (the difference between births numbering 1.15 million and deaths totaling 537,000) resulting in a population gain of 562,000. It is crucial to highlight that outflows act as a brake on population growth. Had no New Yorkers moved out during the 2010s, the combination of inflows and natural increase would have led to a population increase of nearly 3.2 million, putting inordinate stress on the city’s infrastructure and resources.
The primary components of change for 2010 to 2020 are also shown on the far right in Figure 7.3, with natural increase (613,000) in yellow, net migration (-51,000) in blue, and population change (562,000) represented by the circle. Alongside 2010 to 2020, components for each decade starting in 1900 are displayed, shedding light on the process of population change over more than a century.
Source: U.S. Census Bureau, 1900 to 2020 Censuses; New York City Department of Health and Mental Hygiene; Rosenwaike, I. (1972). Population history of New York City. Syracuse University Press; Population Division—New York City Department of City Planning
As discussed in Chapter 2, since the consolidation of the five boroughs in 1898, New York City has experienced a long-term upward population trajectory. One constant in New York City’s process of population change has been natural increase, or more births than deaths (shown in yellow in Figure 7.3). Migration patterns, on the other hand, have fluctuated dramatically over the decades. For the first four decades of the 20th century, more people moved into New York City than moved out, resulting in net migration inflows (shown in blue in Figure 7.3), contributing to rapid population growth. This was in part due to substantial international inflows, largely from Europe, in the earliest decades of the 20th century. Immigration began to slow as restrictive immigration laws were passed by Congress in the 1920s, and the Great Depression further dampened international flows in the 1930s. But many people moved to New York City from within the United States, including as part of the Great Migration, during which millions of Black Americans moved to the North (including to New York City), the Midwest, and the West. Domestic inflows from Puerto Rico picked up from the mid-1940s to the mid-1960s, but post-World War II suburbanization accelerated during this period, resulting in many more New Yorkers moving out of the city and into adjacent counties in the region. Consequently, net migration turned negative beginning in the 1940s and has remained negative each decade since; that is, for over eight decades more people have moved out of New York City than have moved in.
The passage of the 1965 Immigration and Nationality Act, the foundation of the immigration system we have today, came at a pivotal time in the city’s history. In the 1970s, New York faced a severe fiscal crisis, the housing stock lay in ruins in many neighborhoods, and millions of New Yorkers sought to live elsewhere. This was the first full decade after the passage of the new immigration law, and 783,000 immigrants—the first large wave from Latin America, Asia, and the non-Hispanic Caribbean who were the early beneficiaries of the 1965 Act and its subsequent amendments—arrived in a city in turmoil. Net migration losses were nearly 1.15 million, after factoring in immigration, indicating that net domestic outflows were approximately 2 million. With natural increase of 339,000 partially offsetting net migration losses, the city’s population plummeted by roughly 800,000. The entry of post-1965 immigrants helped stem what could have been even greater catastrophic population losses in the 1970s and set the stage for the city’s demographic comeback.
Growth of 336,000 occurred in the 1980s for two reasons. First, the slowing of domestic outflows, coupled with the arrival of 856,000 immigrants, sharply attenuated overall migration losses to an estimated 72,000 persons. Second, natural increase rose to 408,000, a result of births to Baby Boomers (many of whom had delayed childbearing, compared to earlier generations) and fertility among a youthful immigrant population. Thus, the overall increase was a product of the direct effect of people immigrating, but also of the relative youth and fertility of these newcomers. The 1990s saw immigration cross the 1 million mark; nevertheless, net migration losses totaled 107,000. These migration losses were offset by natural increase of 584,000, resulting in growth of 477,000 that propelled the official population of New York City to over 8 million for the first time.
In the first decade of this century, losses through net migration increased to 445,000, notwithstanding lawful immigration of 968,000 people. With natural increase of 643,000 offsetting migration losses, the city’s population grew by 199,000 during the decade. Given continued net domestic outflows, the city would have sustained huge population losses were it not for the entry of immigrants.
As shown earlier, New York City’s population grew substantially in the 2010s, pushing it past 8.8 million, even as net migration losses remained a prominent feature of the city’s demography. Many people come to the city, avail themselves of its opportunities, and then leave for a variety of reasons including the desire for more space, a job change, or retirement. Indeed, for over eight decades, New York City’s role as a net exporter of population has been a defining feature of its population dynamics—with migration losses usually offset by natural increase. The continuous flow of people plays a key role in shaping the city’s population, with movement into and out of New York creating a population churn that reinvigorates the city with new New Yorkers who contribute to its vibrant economic, social, and cultural fabric.
Source U.S. Census Bureau, Population Estimates Program (Vintage 2024)
Changes in population trends since 2020 have largely been determined by massive shifts in migration patterns. At the height of the pandemic there were short-term, though steep, shifts in migration levels. Immigration dropped precipitously in 2020 as borders and consulates closed, and domestic outflows increased as many people chose to move out of New York City. As a result, the city’s population decreased by 287,000 between mid-2020 and mid-2021 (Figure 7.4).
With each passing year after the onset of the pandemic, net domestic outflows moderated and net international inflows increased. From mid-2023 to mid-2024, net domestic outflows were roughly in line with levels experienced in the 2010s, and net international migration reached highs not experienced since at least 2000, reflecting the resumption of migration after Covid-era shutdowns and delays as well as inflows of asylum seekers to New York City. During this time net international inflows more than offset net domestic outflows, which resulted in net migration gains, a reversal from net migration losses that have occurred for several decades. While New York City’s population has returned to growth, its mid-2024 population of 8.5 million remains below its 2020 peak of 8.8 million.
As we have observed, there is a long-term pattern of immigration partially offsetting domestic migration losses, thereby playing a key role in sustaining the city’s population. A reduction in immigration levels would lessen this population bolstering effect, creating demographic headwinds for the city that might limit population growth or potentially facilitate population decline.
In addition to directly contributing to population growth, immigration has a secondary effect on population processes, namely through fertility. Population growth each decade was the result of natural increase, in no small part due to births to immigrant mothers in the city. Nearly one-half of all children born to New York City residents in 2023 had an immigrant mother; 60 percent had at least one immigrant parent—a striking indication of the secondary effect of immigration on population growth.
As outlined in Section 7.1, natural increase is a critical component of population growth in New York City, particularly in the context of typical net out-migration. However, natural increase began a downward trend in the 2010s and has been substantially lower in the 2020s, despite recovering somewhat after a precipitous drop at the height of the Covid-19 pandemic (Figure 7.5).
Source: U.S. Center for Disease Control and Prevention, National Center for Health Statistics; Population Division—New York City Department of City Planning
New York City’s birth rate has declined in recent decades, following national and international trends. In 2000, the crude birth rate was 15.1 births per 1,000 population, dropping to 11.0 in 2020.3 In absolute terms, the number of births to city residents was 121,000 in 2000, peaked in 2007 at over 123,300, and followed a downward trend thereafter, reaching 96,600 in 2021, shortly after the onset of the pandemic. In subsequent years, births continued to decrease, dropping to 91,800 by 2023—a decline of one-quarter over the 2007 high point.
The number of deaths among city residents totaled 60,400 in 2000, declining to 52,000 in 2010, attributable in part to rising life expectancy among older adults, a trend observed nationwide. However, with the aging of the population, deaths increased slightly to 54,000 by 2019. During the height of the Covid-19 pandemic in 2020, deaths surged to 82,900 but were roughly in line with pre-pandemic levels by 2023.
Natural increase reflected the differing trajectories of births and deaths. It reached a high of 69,800 in 2009, but declined 47 percent to 36,900 in 2023. Alongside immigration, natural increase has historically played a central role in the city’s long-term trajectory of population growth. In the context of declining natural increase, any diminution in immigration would compound challenges to maintaining that growth.
The pivotal role played by immigration in shaping New York City is evidenced by the high proportion of residents with foreign roots. This group—known as the foreign-stock population—includes both foreign-born individuals (first generation) and U.S.-born individuals with at least one foreign-born parent (second generation). Together, they make up over two-thirds of the city’s population, compared to just 29 percent of the overall U.S. population.4
Naturalization is the process through which immigrants acquire U.S. citizenship. To naturalize, an immigrant must be at least 18 years of age, have been lawfully admitted for permanent residence in the United States, and have continuously resided in the United States for at least five years. Those naturalizing as a spouse of a U.S. citizen may do so after living with their spouse for a period of three years as a lawful permanent resident.
The proportion of the foreign-born population that had acquired citizenship through naturalization rose by nearly 10 percentage points from 2000 to 2013, reaching 54 percent, and rose further to 59 percent in 2023 (Figure 7.8). The overall increase in the percent naturalized over the past decade was driven, at least in part, by an increase in the average time spent in the United States, and not by a change in the proclivity to naturalize. While the overall number of immigrants in New York City remained roughly steady between 2013 and 2023, the number of recent entrants declined; at the same time the number of long-resident migrants increased substantially (Table 7.2). Given that those with longer durations of stay in the United States have higher rates of naturalization, it is logical that an increase in long-term residents is reflected in an increase in overall naturalization rates. As measured in 2023, among those who entered the country before 2000, 82 percent had naturalized; for those who entered between 2000 and 2009, 59 percent had naturalized; and, for those who entered in 2010 or later, just one-quarter had naturalized, reflecting their relatively shorter length of time in the United States. Recent arrivals also include many individuals who stay in the United States for shorter periods on temporary visas, such as those for study or work, and are not eligible for naturalization. Indeed, two-thirds of naturalized citizens in 2023 had arrived in the United States prior to 2000, compared to just 1-in-7 having arrived in 2010 or later.
Naturalization rates vary by area of origin. The foreign-born population from the non-Hispanic Caribbean had the highest proportion naturalized in 2023 at nearly three-quarters, up from 66 percent in 2013, reflecting a decline in the proportion of recent entrants. In contrast, immigrants from Latin America had the lowest naturalization rate, with under one-half naturalized. However, naturalization rates for immigrants from Latin America, as well as from Asia and Africa, reflected increases over the past decade. The proportion naturalized from Europe, on the other hand, held steady between 2013 and 2023, at about 66 percent, reflecting a stable share of recent entrants over the decade.
2013
2023
While we have focused on the importance of immigration in sustaining the city’s population, the stream of immigrants tends to be smaller than domestic inflows, which play a crucial—and often underappreciated—role in shaping the socioeconomic landscape of major cities. While the inflow of domestic migrants to the city is significantly smaller than domestic outflows, domestic in-migrants generally have stronger socioeconomic indicators than domestic out-migrants, and both groups have higher average socioeconomic outcomes than city residents overall. Immigrants, who are the smallest stream numerically, have comparatively lower socioeconomic indicators than domestic migratory streams into and out of the city. Note that migration here refers to movement over the past year (see Box 7.4 for more information on how migration is measured). Domestic migrants encompass foreign-born individuals who moved within the United States, after immigrating in earlier years; indeed in 2023 about 22 percent of domestic in-migrants and about 29 percent of domestic out-migrants were foreign-born.
Median earnings of civilian-employed domestic in-migrants ages 21 and over were $70,500 in the 2019-2023 period, while domestic out-migrants had median earnings of $66,300 (Table 7.3).8 Similarly, the median household income for domestic in-migrants was higher ($109,300) than for domestic out-migrants ($99,100). Higher earnings and incomes are, in part, a reflection of higher average levels of education; 71 percent of domestic in-migrants ages 25 and over had a college degree (i.e, bachelor’s degree or higher), compared to 58 percent of domestic out-migrants. However, with respect to poverty, in-migrants had a higher poverty rate (16 percent), compared to out-migrants (13 percent). Both domestic in-migrants and out-migrants tend to be better off than New York City residents overall, reflecting the fact that migratory moves typically require a significant outlay of resources. In places like New York City, domestic in-migrants represent a particularly distinctive group: They are more likely to be college-educated, employed in high-skill sectors, and economically mobile.
Approximately two-thirds of in-migrants to New York City come from other parts of the United States, while about one-third are international migrants (i.e., immigrants) (data not shown). International migrants to the city typically had more modest socioeconomic indicators than their domestic counterparts. Median earnings for international migrants ages 21 and over were $42,400 compared to $70,500 for domestic in-migrants; similarly, median household income for international migrants was $70,600 compared to $109,300 for domestic in-migrants. Roughly 3-in-10 international migrants were below the poverty line compared to 16 percent of domestic in-migrants. And, 55 percent of international migrants ages 25 and over had a bachelor’s degree compared to 70 percent of domestic in-migrants. Not only do international migrants have lower socioeconomic indicators on average than domestic migrants to the city, but they also tend to have lower socioeconomic indicators compared to city residents overall. Despite this, immigrants play an outsized role in the city’s workforce and broader economy.
As noted earlier, many people come to the city to benefit from its economic, cultural, and social opportunities, and then leave for a variety of reasons. This ebb and flow, which is a defining feature of New York City’s dynamic population, means that the continued success of New York’s economy depends on new workers replacing those who leave, such as those in the large Baby Boom cohorts as they continue to retire. These new workers are often immigrants, who comprise a substantial and important portion of the resident workforce in New York City. Indeed, more than two-fifths of resident workers were foreign-born in 2023 (Figure 7.9). With respect to citizenship status, one-quarter of resident employed workers were naturalized citizens, while 19 percent were non-citizens. The latter category encompasses lawful permanent residents and other non-citizens authorized to work in the United States, as well as those who were not authorized to work in the United States. The foreign-born include not only recent arrivals, but also those who have lived in the city for decades. In fact, immigrants arriving prior to 2000 account for 18 percent of the resident labor force, while recent arrivals—those arriving between 2010 and 2023—account for 15 percent.
It is instructive to see how nativity and year of arrival of the foreign-born intersect with age and with industry of employment. While foreign-born New Yorkers comprised 43 percent of the city’s labor force, they accounted for one-half or more of workers in the age groups 45 to 54, 55 to 64, and 65 and over (Figure 7.10).
Recent arrivals, i.e. those who immigrated in 2010 or later, comprised 15 percent of New York City’s workforce, but they were disproportionately present in younger age groups, since many immigrants arrive as young adults. About 19 percent of the labor force ages 25 to 44 were recent arrivals in 2023, but only 8 percent of those ages 55 to 64 and 4 percent of those ages 65 and over were similarly classified. In contrast, those who arrived before 2000 were concentrated in the older age groups, including roughly 40 percent of workers ages 55 to 64, as well as those 65 and over. Only 11 percent of workers ages 35 to 44 arrived in 2000 or earlier.
To better understand the role of immigrants in the city’s workforce, it is important to identify the industries where they predominate. The U.S. Census Bureau defines industry as the type of business conducted by a person’s employer or the type of business an individual is involved in if they are self-employed. While foreign-born workers made up a substantial portion of all industry sectors in New York City, immigrants were particularly concentrated in Construction, accounting for nearly two-thirds of the 203,000 workers in this sector in the 2019-2023 period (Figure 7.11). At the same time, construction had the highest percentage of non-citizen workers, who comprised 39 percent of all workers in this industry—more than the share within any other industry.
Foreign-born workers comprised one-half or more of those employed in three other industries: Transportation and Warehousing, and Utilities (56 percent), Other Services (except Public Administration) (54 percent), and Manufacturing (51 percent). Transportation included 54,000 foreign-born workers in taxi and limousine service, who comprised roughly 4-in-5 workers in this subsector (data for subsectors not shown). Other Services included 24,000 foreign-born workers in private households, 16,000 in beauty salons, 10,000 in nail salons and other personal care services, and 8,000 in drycleaning and laundry services; these immigrants comprised roughly two-thirds or more of workers in each of these subsectors.
Immigrants had the highest numerical presence in Educational Services, and Health Care and Social Assistance, which was also the largest industry sector in New York’s economy, employing 1.17 million workers overall, 44 percent (519,000) of whom were foreign-born. This sector included 108,000 foreign-born workers in home health care services, who accounted for three-quarters of workers in this subsector; 101,000 in general medical and surgical hospitals, and specialty hospitals; 69,000 employed by elementary and secondary schools; and 61,000 in individual and family services. The next largest industry sector, Professional, Scientific, and Management, and Administrative and Waste Management Services, employed 605,000 resident workers overall, 212,000 of whom were foreign-born. While this industry sector represented one of the lowest proportions of foreign-born workers, at roughly one-third, the 37,000 foreign-born workers employed in its subsector services to building and dwelling (except landscaping services) accounted for 71 percent of workers. The city’s third largest industry sector, Arts, Entertainment, and Recreation, and Accommodation and Food Services employed 179,000 immigrants, largely in two subsectors: food services and drinking places (except alcoholic beverages) as well as traveler accommodation, where they comprised roughly three out of every five employees.
Industry sectors where immigrants had a limited numerical presence and accounted for a small share of the total included Information, with 38,000 foreign-born workers who comprised 24 percent of the total in this sector, and Public Administration, with 53,000 foreign-born workers (33 percent of the total).
This section discusses the types of housing immigrants occupy in New York City, using data from the 2023 New York City Housing and Vacancy Survey (NYCHVS).9 Housing type refers to tenure (owner- and renter-occupied) and legal or regulatory status within tenure categories (Table 7.4). Owner-occupied housing is comprised of conventional and co-op/condo units. Conventional units refer to privately owned houses or units in buildings that are not part of a co-operative or condominium development. This includes single-family houses as well as units that are part of commercial or industrial buildings, such as those with commercial space on the ground floor and an apartment above. Co-op/condo refers to co-operative and condominium developments.
Renter-occupied units include market rate, controlled/stabilized, public housing, and other regulated units. Market rate units are those without governmental restrictions or regulations on rents. These units may never have been subject to government rent regulation or may have been regulated in the past but are no longer subject to these controls. There were over 1.1 million occupied market rate units in the city, making this the largest category in 2023. Controlled/stabilized units include those that are subject to the Rent Control Law and Regulations, as well as units where other government regulations determine the level of rent increases. Controlled/stabilized units numbered nearly 1 million and were the second largest category of rental units in the city’s housing stock. A large majority of these units were rent stabilized, covered under the auspices of the Emergency Tenant Protection Act of 1974. Public housing refers to units administered by the New York City Housing Authority and is intended for low- and moderate-income tenants. Other regulated rental units include Mitchell-Lama developments and other affordable housing by New York State and City Programs.
Table 7.4 examines housing type by nativity of the householder. Immigrant households were defined as those in which the householder was an international migrant, regardless of the nativity of other members of the household. Table 7.4 shows that there were 3.4 million occupied housing units in New York City in 2023, of which 1.4 million or 41 percent had a foreign-born householder. Immigrant households comprised a slightly higher proportion in owner-occupied (44 percent) than renter-occupied units (40 percent). Among owner-occupied units, immigrant households accounted for one-half of conventional units, in contrast to a little over a third of co-op/condo units. Among rental units, immigrant households comprised 43 percent of controlled/stabilized units, in contrast to 39 percent of market rate units and just 28 percent of public housing units.
While recent arrivals (i.e., those who first migrated to the United States in 2010 or later) accounted for 1-in-10 households, they represented a larger proportion of householders who rent their homes (12 percent) than those who own them (3 percent). This reflects a range of factors, such as the time it can take to accumulate sufficient resources to purchase a home as well as the knowledge to navigate the local real estate market. However, with increased time spent in the United States, home ownership increased among immigrants. Longer-resident immigrant households were 32 percent of all households but accounted for 41 percent of owner-occupied units.
There was a considerable amount of new housing built during the 2010s and early 2020s. Formerly industrial sections of the East River waterfront in Long Island City and Williamsburg were epicenters of a construction boom, along with Hell’s Kitchen in Manhattan and neighboring Hudson Yards, which was constructed on new platforms over train tracks west of Pennsylvania Station. The Financial District and Central Harlem in Manhattan, and Downtown Brooklyn, Bedford-Stuyvesant, and Crown Heights in Brooklyn also experienced substantial increases in the number of housing units over the 2010s. According to the NYCHVS, approximately 162,000 of the occupied units in 2023 were built in 2010 or later. Of these, about 41 percent were occupied by immigrant households, roughly in line with their overall share of housing, suggesting that the foreign-born occupy new housing at the same rate as housing in general and are not disproportionately priced out of the new construction market.10
Of the city’s 8 million residents ages five and over, only a slight majority (52 percent) speak English at home (Figure 7.12), reflecting the significant foreign-born presence in the city. Among the remaining 48 percent, or 3.8 million people, who speak a language other than English at home, 1.78 million—equivalent to 22 percent of the city’s population—are considered limited English proficient (LEP) (see Box 7.5 for details on how limited English proficiency is defined).
Table 7.5 shows the top 10 languages spoken in New York by the city’s LEP population.11 Spanish alone is spoken by close to one-half (47 percent) of the LEP population. Chinese12 is a distant second at 19 percent, followed by Russian (6 percent), Bengali (4 percent), Yiddish (3 percent), and Haitian (2 percent). Thus, just six languages account for over 80 percent of the LEP population. Although it might appear that focusing on a few top languages would allow resources to be efficiently targeted across neighborhoods, the most spoken languages differ significantly from one area of New York City to another. As a result, language-specific resources must be tailored to the unique linguistic needs of each neighborhood.
New York is the most polyglot city in the world,13 largely because immigrants come from distant corners of the globe, bringing their often-endangered languages with them. The American Community Survey (ACS), being a sample survey, is unable to reliably capture every language spoken in the city. In addition, languages spoken by only a few people are not individually tabulated by the ACS but are aggregated into a residual category. Nevertheless, the ACS shows a remarkable breadth of languages from across the world that are spoken in the city. The focus here is on the languages listed in ACS data and spoken by the population with limited English proficiency (LEP).
The largest concentrations of the LEP population are in Queens (619,000) and Brooklyn (547,000), which together account for two-thirds of the city’s LEP population. Queens (28 percent) also had the largest proportion that was LEP, while Brooklyn (22 percent) was at the city average (Table 7.6). With respect to the other boroughs, the proportion of the Bronx (26 percent) that was LEP was above the city average, while Manhattan and Staten Island were substantially lower.
Figure 7.13 shows the size of the population with limited English proficiency in each borough subsection, which comprise combinations of neighborhoods. Also shown are the 39 languages with reliable estimates spoken by the LEP population (top right within figure)—each box represents one such language. The number of speakers for languages without reliable estimates are not shown. In addition to Spanish, Chinese, Russian, Bengali, Yiddish, and Haitian, the top 10 languages include Korean, Arabic, French, and Polish, which together accounted for 86 percent of the LEP population. The link on the left side of the map provides a list of 77 languages (listed in the ACS) spoken by at least one person in the city—this includes the 39 languages with a reliable count of speakers, as well as 38 additional languages for which the count of speakers is not reliable but suggests there is at least one person who speaks that language. These languages run the gamut from Albanian and Arabic to Vietnamese and Yoruba.
While it was noted earlier that just six languages—Spanish, Chinese, Russian, Bengali, Yiddish, and Haitian—can be used to reach 4-in-5 people with limited English proficiency, the top languages differ substantially across the boroughs. Clicking on a borough subsection in Figure 7.13 provides languages spoken in the lower right corner, with each box representing a reliable count of speakers (languages without a reliable count of speakers are not shown).
Among borough subsections, Southern Brooklyn (290,000) and Northwestern Queens (285,000) had the largest number of people with limited English proficiency, which together accounted for nearly one-third of the city total. Northwestern Queens had 20 languages with reliable estimates of the number of speakers, and 44 languages spoken overall, the most for any borough subsection, while Southern Brooklyn had 15 languages with reliable estimates, and a total of 42 languages. A comparison of these subsections shows that linguistically diverse areas often include unique languages in their top five, with commonly spoken ones ranked differently across locations. In Southern Brooklyn, for example, Chinese was the most common language, spoken by 28 percent of the LEP population, followed by Russian, Spanish, Yiddish, and Arabic. In contrast, in Northwestern Queens, Spanish was spoken by more than half of the LEP population, followed by Chinese, Bengali, Polish, and Russian. In both areas, the top five languages accounted for roughly 80 percent of the LEP population.
Spanish was the top language spoken in each subsection of the Bronx, ranging from 68 percent of the LEP population in the Eastern Bronx to over 80 percent in the Western and South Bronx. Spanish was also the top language on the North Shore of Staten Island, while Chinese and Russian predominated in the Central and Southern subsections of the borough. Even the borough subsections with the least language diversity—the Upper West Side of Manhattan and Southern Staten Island—each had 11 languages spoken by their LEP populations.
New York City is aging, which is primarily due to a decline in fertility and to increased life expectancy among both native- and foreign-born residents. This has resulted in a sharp drop in the size of the population under 18 (children) and a large increase in the population ages 65 and over. In 1970, the population under age 18 was more than twice the size of the population ages 65 and over, 2.2 million compared to 948,000, and their respective shares of the city’s population were 28 percent and 12 percent, a 16-percentage point gap (Figure 7.14). By 2023, the number of children had declined steeply to 1.6 million, while the population ages 65 and over had soared to 1.4 million, with their respective shares of the city’s population at 20 percent and 17 percent, a 3-percentage point gap. The aging of the population is also reflected in the city’s median age, which increased from 32.4 years in 1970 to 38.8 years in 2023.
This demographic shift aligns with national patterns: The proportion of individuals ages 65 and over in the United States has increased from 10 percent in 1970 to 18 percent in 2023, with the median age rising from 28.1 years to 39.1 years over this period (data not shown). The share of the nation’s population ages 65 and over is projected to reach 21 percent by 2030,14 at which point the population ages 65 and over is expected to surpass the number of children for the first time in history. This has far-reaching implications for the economy, as the growth in the traditional working-age population fails to keep pace with increases in the population ages 65 and over.
Source: U.S. Census Bureau, 1970 to 2010 Censuses, 2013 and 2023 American Community Survey—Public Use Microdata Sample; Population Division—New York City Department of City Planning
Newly arrived immigrants are generally young, in their prime working years, and usually become parents once they are in the United States. These flows, as noted earlier, are key to sustaining the city’s growth, but continued immigration will not halt the aging of the population.15 Immigrants, like their native-born counterparts, have aged over time, with their median age increasing from 39.2 in 2000 to 50.2 in 2023. Peaks and valleys in immigration to the city are reflected—after a lag—in the proportion of the population ages 65 and over that is foreign-born. The foreign-born share of the city’s 65 and over population peaked in 1970, when 58 percent of the 948,000 residents in that age group were foreign-born (Figure 7.15). At that time, most immigrants ages 65 and over were part of the large early 20th century flows from Europe, and their numerical strength was reflected in their sizable share of the 65 and over population in 1970. The cessation of large-scale immigration in the 1930s and 1940s was reflected in a diminishing share of the foreign-born among those ages 65 and over in 1980 (41 percent) and 1990 (32 percent). While the overall population ages 65 and over was essentially unchanged between 1970 and 1990, the number of foreign-born in this age group dropped 45 percent.
After 1965, there was a dramatic increase in immigration from Latin America, Asia, and the non-Hispanic Caribbean. The resurgence of large-scale immigration to the nation provided a large supply of young, working-aged people who are now beginning to enter older age groups. Between 1990 and 2023, the overall foreign-born population in the city grew by nearly 50 percent, but the foreign-born ages 65 and over increased 140 percent, from 302,000 to 727,000. Consequently, the foreign-born comprised over one-half the population ages 65 and over by 2023. It should be noted that growth in the older foreign-born population was due not only to the aging of foreign-born residents who entered during their young working ages, but also due to the recent entry of older people. Indeed, nearly 57,000, or 8 percent, of the foreign-born aged 65 and over were recent entrants, arriving in 2010 or later when they were at least 52 years of age. China and the Dominican Republic accounted for about 1-in-3 of these older, recent immigrants (data not shown).
Like the nation’s population, more New Yorkers are projected to be in older age groups over the next few decades. The question is not whether an increase in the population ages 65 and over will occur, but rather the scale of the increase. It is safe to say that the foreign-born will continue to have a major presence in the city’s population ages 65 and over, as residents in their late middle-ages are disproportionately foreign-born. The age cohort 55 to 64, for example, numbered 1.1 million in 2023, with the foreign-born share at 56 percent or 618,000 people. In just the next decade, as this cohort ages, it will significantly increase both the size of the 65 and over population and its immigrant component. More importantly, unlike previous periods, the mix of countries represented in these groups will reflect the diverse post-1965 immigrant streams, resulting in unprecedented diversity among older New Yorkers.
In 1900, the vast majority of the population of New York City (98 percent) was White. (See Box 7.6 for race and Hispanic origin categories available in census data.) Over the next several decades, domestic and international migration transformed the city’s racial and ethnic landscape. By 1950, due to domestic inflows, 9 percent of New York City’s population was Black and 3 percent was Hispanic, with the proportion White declining to 87 percent (Figure 7.16). After the immigration reforms of 1965 there was a substantial increase in international flows, especially from non-European countries, considerably increasing the racial and ethnic diversity of the city. By 1990, no single race/Hispanic group constituted a majority of the city’s population. In 2020, the White population was still the largest group, but represented just 31 percent of New York City’s population; the Hispanic population comprised 28 percent, the Black population 20 percent, the Asian population 16 percent, and all other groups 5 percent.
* Asian non-Hispanic includes Pacific Islander for 1950 to 1990
Source: U.S. Census Bureau, 1950-2020 Censuses; Population Division—New York City Department of City Planning

Note: Pacific Islanders are included with the Asian population for the 1980 to 1990 and 1990 to 2000 time periods due to data limitations
Source: U.S. Census Bureau, 1980 to 2020 Censuses; New York City Department of Health and Mental Hygiene; Population Division—New York City Department of City Planning
Earlier, it was noted that the city has experienced net migration losses, which were usually outpaced by natural increase, resulting in population growth. But the drivers of population growth or decline for each race group often do not follow the citywide trend and vary over time. Figure 7.17 shows the components of change for the past four decades with the solid bars indicating natural change, or the difference between births and deaths, and the hatched bars showing net migration, or the difference between those moving in and moving out of New York City.
The steep decline in the White population in the 1980s and 1990s was a result of net migration losses combined with natural decrease. White population losses moderated in the 2000s and leveled off in the 2010s as net outflows declined and natural change turned positive. In contrast, Black population growth in the 1980s and 1990s reflected the broader citywide pattern of population growth through natural increase; however, in the 2000s and 2010s, migration losses outpaced declining natural increase, leading to Black population decline. The Asian and Hispanic populations both grew rapidly in the 1980s and 1990s due to net inflows alongside natural increase, but in 2000s and 2010s Hispanic population growth moderated as net migration turned negative, while the Asian population maintained rapid growth resulting from both positive net migration (driven by immigration) and natural increase. Consequently, over one-half of the city’s population growth in the 2010s was due to the increase in the Asian population. If patterns from the last decade hold, the Asian and Black populations are likely to be comparable in size by 2030.
While migratory flows have reshaped the city’s racial/Hispanic composition, looking only at broad racial/Hispanic categories obscures the significant diversity that migration has engendered within these groups. The 2020 Census was the first to ask all respondents to check off their race group and to write-in more detailed origins. The detailed origins of New Yorkers span every corner of the globe. Figure 7.18 lists only the most-reported detailed origins, each with a count of over 100,000, within the race/Hispanic categories, sufficient to glimpse the layered history of the peopling of the city.17
In 2020, among those identifying as Hispanic, 596,000 stated they were Puerto Rican—a group which gained a notable foothold in the city as domestic migrants from the U.S. territory of Puerto Rico in the 1940s and 1950s, when they comprised the bulk of the city’s Hispanic population. But due in part to Puerto Rican net outflows, Dominicans have become the largest Hispanic group, numbering 702,000 in 2020. Dominicans first established a sizable presence after the passage of the 1965 Immigration and Nationality Act and were the largest Hispanic group in the city in 2023. Other major beneficiaries of the 1965 Act included many others from the Americas, with substantial flows from Mexico in North America; Ecuador and Colombia in South America; as well as Honduras and El Salvador in Central America.
Among White New Yorkers, Italians, who were one of the last major European groups to migrate in large numbers to the city, had the largest presence numbering 509,000 in 2020, followed by 439,000 Irish, 310,000 Germans, and 279,000 English. Detailed groups within the White population also included Russian (185,000) and Polish (169,000), after a resurgence in immigration in recent decades building on an established presence in the city from over a century ago. New Yorkers who identified as Middle Eastern or North African (classified in the 2020 Census as White), included Egyptians, Israelis, and Yemenis, who largely began to arrive in New York City after the passage of the 1965 Act.
* Chinese includes 17,473 Taiwanese individuals
Note: Only detailed groups with 100,000 or more individuals are shown. Detailed groups are not mutually exclusive; individuals may identify with several simultaneously. Counts for Hispanic groups represent the count of people who identified with each detailed group in the Hispanic origin question, rather than the race question, making the counts mutually exclusive of other Hispanic detailed groups, but potentially overlapping with any combination of responses to the non-Hispanic detailed race groups.
U.S. Census Bureau, 2020 Census; Population Division—New York City Department of City Planning
The largest self-reported detailed group for Black New Yorkers was African American, with 848,000, many of whom were descendants of migrants from the South. Other groups with relatively recent flows to New York City included Jamaicans (194,000), Haitians (117,000), and sub-Saharan African groups, including Nigerians, Ghanaians, Senegalese, and Ethiopians.
Finally, Asian New Yorkers had origins across the continent. Those identifying as Chinese were the largest group, numbering 679,000, followed by 256,000 Asian Indians, 105,000 Koreans, and 103,000 Bangladeshis; Filipinos (99,000) and Uzbeks (26,000) were the largest groups from Southeast Asia and Central Asia, respectively (data not show). While there has long been immigration from China to New York City, the growing Chinese population, along with that of other Asian groups, has been facilitated by the 1965 Act.
Analyzing the age distribution within New York City’s race/Hispanic groups provides a window into both the city’s demographic history and its future trajectory. The White population, for example, comprised 31 percent of the city’s population (Figure 7.19), but accounted for 38 percent of those ages 65 and over—an age cohort that reflects the city’s demographic past, when the White population comprised a larger proportion of the city. But Hispanic New Yorkers, who made up 28 percent of the population, were the largest group among those under 18 (34 percent) and those 18 to 24 (33 percent)—age cohorts that represent the city’s demographic future. In contrast, the Asian population was underrepresented in younger age cohorts; they made up 15 percent of New York City’s population, but accounted for 12 percent of those under the age of 18. This pattern reflects the fact that a substantial portion of the Asian population in New York City is foreign-born, and many immigrants arrive in young adulthood. The Black population represented roughly 20 percent of the population for all age groups. In the decades ahead, as younger generations age, the city’s overall composition will increasingly mirror the relatively larger proportion of the Hispanic population in younger age groups. While the diversity seen in the youth today signals that the city’s population will remain remarkably diverse in the decades ahead, future migration will continue to influence the racial/Hispanic makeup of New York.
The population churn of hundreds of thousands of people moving into and out of New York City each year imparts a dynamism to the city—an ebb and flow of people that brings new ideas, energy, and constant change. This churn includes both those moving to and from places in the United States, as well as those moving to and from countries abroad, yielding close ties with locations across the country and around the world. Domestic migrants include many who are foreign-born: They may have first arrived in New York City before relocating elsewhere in the country, while others may have settled elsewhere in the United States before making their way to New York.
Newcomers have always played an outsized role in the dynamic social fabric of New York City, and future immigrants as well as those who are already here will continue to contribute to the city’s culture, economy, and institutions. In 2023, there were 3.1 million foreign-born individuals living in the city, outnumbering the combined foreign-born populations of the next 4 largest immigrant cities: Los Angeles, Houston, Chicago, and San Jose. In New York City, immigrants comprised 43 percent of the workforce and accounted for 41 percent of householders in the city, both higher proportions than their 38 percent share of the overall population. Immigration from countries across the globe has led to increasing racial diversity in the city, as well as a breadth of origins within any given race/Hispanic category. Immigrant mothers accounted for almost one-half of all births to city residents, and just under two-thirds of the city’s population was either foreign-born or had at least one immigrant parent. New York City is defined by immigration, which has shaped and influenced every aspect of the metropolis, from economics to politics, from food to fashion.
Changes in the contours of the foreign-born population will likely impact how immigrants fit into the broader social fabric of the city. Like the population as a whole, the foreign-born population in New York City is aging. After the U.S. immigration reforms of 1965, flows to the United States increased from countries around the world, with many coming to New York City. The cohort of immigrants who arrived as young adults in the 1970s and 1980s is now entering their 60s and 70s. This has far-reaching implications, since the foreign-born comprise a disproportionate share of the workforce and services needed for the older foreign-born may differ from their native-born counterparts.
Immigration has played a major role in population growth in recent decades: Immigrant flows have mitigated what could have been catastrophic population losses in the 1970s, stabilized the city’s population in the 1980s, and enabled it to exceed 8 million residents in 2000. While the city has recently experienced record immigration, this trend is unlikely to persist, due to evolving immigration policy. At the same time, natural increase has slowed due to a long-term trajectory of decreasing birth rates. Should these two foundations of population gains diminish, alongside continued typical net domestic migration losses, population growth may slow or stagnate in the coming years. The city may be entering a new phase in its demographic history, one with headwinds to population growth; regardless, immigration and immigrants will certainly continue to shape many facets of life in the city for decades to come.
The Population Balancing Equation was used to calculate total net migration using the residual method, which allows an unknown component of the equation to be calculated if all other components are known. The Population Balancing Equation states that the population at a given point in time is equal to the population at an earlier point in time plus natural change, plus net migration. Natural change is the balance of births and deaths; net migration is the balance of movement in and movement out (see Box 7.2 for more details on the components of change). Thus, population change can be expressed using the Population Balancing Equation. For the decade from 2010 to 2020, the Population Balancing Equation can be written as
\(Population_{2020} = Population_{2010} + Natural\ Change_{2010-2020} + Net\ Migration_{2010-2020}\)
A rearrangement of the Population Balancing Equation can also provide a calculation for population change over the decade:
\(Population\ Change_{2010-2020} = Population_{2020} - Population_{2010}= Natural\ Change_{2010-2020} + Net\ Migration_{2010-2020}\)
The Population Balancing Equation can also be used to calculate net migration as a residual of population change (population at time 2 minus population at time 1) and natural change:
\(Net\ Migration_{2010-2020} = Population\ Change_{2010-2020}-Natural\ Change_{2010-2020}\)
Calculating net migration as a residual presents an alternative to migration data sources that each have their own limitations. Data on the size of the population and natural change are generally reliable and available; the decennial census enumerates the population, and records of births and deaths are quite robust. Data on net migration, however, are often incomplete or estimated. Using this approach, net migration can be estimated as the residual of New York City’s population change—from 8,242,000 in 2010 to 8,804,000 in 2020—accounting for a natural change of 613,000. Thus,
\(Net\ Migration_{2010-2020} = (8,804,000-8,242,000)-613,000= -51,000\)
No single data source can supply data on domestic in-migration and out-migration as well as international flows—immigration and emigration—and most data that are available are estimates. Figures from different data sources do not always align closely. To produce estimates of inflows and outflows for the 2010 to 2020 period, the New York City Department of City Planning (DCP) used 2010 (adjusted) and 2020 Census data for total population, estimates from the 2010 through 2019 1-year American Community Survey (ACS) for domestic in-migration and international immigration, estimates from the Census Bureau’s Population Estimates Program (Vintage 2020) on net international migration, and data from the New York City Department of Health and Mental Hygiene for natural change. (Disaggregated birth and death data in Figure 7.2 are sourced from the U.S. Centers for Disease Control.) Using the residual method described above, net domestic migration was calculated as the residual of net migration and net international flows. Domestic out-migration was calculated as the residual of net domestic migration and domestic in-migration, and international emigration was calculated as the residual of net international migration and international immigration.↩︎
Based primarily on net new construction data, an upward adjustment of 67,000 people was applied to the 2010 Census enumeration for calculations on population change in this chapter, bringing the citywide population to 8,242,000 from 8,175,000. Adjustments are also used in this chapter for 1970, 1980, 1990, and 2000 – for more detail on the adjustments for these decades, see Chapter 7 in The newest New Yorkers: Characteristics of the city’s foreign-born population (2013 edition).↩︎
Crude birth rates are calculated based on the number of resident births in the calendar year reported by the U.S. Centers for Disease Control and the applicable U.S. decennial census population.↩︎
Estimates are from a DCP analysis of Current Population Survey (CPS) 2023 PUMS data. CPS estimates of the foreign-born population are higher than those from the ACS. According to the CPS, 41.0 percent of New York City’s population and 16.2 percent of the United States population was foreign-born in 2023, compared to 37.5 percent and 14.3 percent, respectively, in the ACS.↩︎
Massey, D. S., Durand, J., & Malone, N. J. (2003). Beyond smoke and mirrors: Mexican immigration in an era of economic integration. New York, NY: Russell Sage Foundation.↩︎
Ibid.↩︎
Capps, R., Gelatt, J., Ruiz Soto, A. G., & van Hook, J. (2020). Unauthorized immigrants in the United States: Stable numbers, changing origins. Washington D.C.: Migration Policy Institute. Retrieved May 15, 2025, from https://www.migrationpolicy.org/sites/default/files/publications/mpi-unauthorized-immigrants-stablenumbers-changingorigins_final.pdf↩︎
It is important to note that medians, as such, do not reflect any individual migrant, but rather the mid-point of the distribution of socioeconomic indicators of the group. While median earnings of civilian-employed domestic in-migrants ages 25 and over were $70,500, half had earnings below this point and half had earnings above. This figure does not provide information on the breadth of the distribution of earnings across this group.↩︎
Data, documentation, and initial findings are publicly available on NYC’s Housing Preservation & Development Research page.↩︎
A proportional adjustment was made to account for 162,020 respondents with missing information on nativity, of whom 155,710 were householders in units built before 2010 and 6,309 were householders in units built in 2010 or later.↩︎
Languages and language categories are referred to using Census Bureau terminology for consistency with American Community Survey data.↩︎
In this report Chinese includes Mandarin, Cantonese, and Min Nan Chinese.↩︎
Perlin, R. (2024). Language city: The fight to preserve endangered mother tongues in New York. New York, NY: Atlantic Monthly Press.↩︎
U.S. Census Bureau, Population Division. (2023). Projected population by age group and sex for the United States, Main Series 2022-2100. [Data set].↩︎
New York City is not alone in the inability of continued migration to stop or substantially slow population aging. It has been found that rates of migration required to materially slow or stop population aging at the national level would be prohibitively large, requiring many times the number of immigrants arriving today, and would result in recently arrived immigrants comprising the vast majority of the population (Uhlenberg, P. (2006). Demography of aging. In D. L. Poston & M. Michlin (Eds.), Handbook of population (pp. 143–168). New York, NY: Springer.).↩︎
DCP acknowledges that there are other terms—e.g., Latinx—people of Latin American origin or descent may use to self-identify. DCP uses “Hispanic” to maintain consistency with data provided and terminology used by the U.S. Census Bureau.↩︎
It is important to note that self-identified detailed origins categories are not mutually exclusive; individuals may identify with several simultaneously. Thus, counts for each group reflect both individuals identifying exclusively with that group and those identifying with it in combination with other groups. Therefore, these counts represent the maximum number of individuals identifying with each group. Counts for Hispanic groups represent the count of people who identified with each detailed group in the Hispanic origin question, rather than the race question, making the counts mutually exclusive of other Hispanic detailed groups, but potentially overlapping with any combination of responses to the non-Hispanic detailed race groups. Detailed groups nest under broad race/ethnicity groups following the Census Bureau’s classification methodology. Some responses may have been reclassified by the Census Bureau. All detailed race and ethnicity data are affected by the Census Bureau’s infusion of statistical noise for privacy protection, and thus come with bands of uncertainty. (For more information on the classifications and noise infusion, see the Census Bureau’s Detailed DHC-A technical documentation.)↩︎