This chapter examines the spatial distribution of New York City’s immigrant population across several layers of geographic detail, analyzing trends from citywide and borough scales down to individual neighborhoods. The chapter first considers the relative size of the foreign-born population of each borough in 2023 and in 2013. It then provides a snapshot of immigrant neighborhoods across the city, including analyses of the number and share of foreign-born residents in each neighborhood and comments on neighborhood-level changes over the past decade.
The chapter then provides a detailed look at spatial patterns in each borough. It first analyzes the areas of origin and the top countries of birth of immigrants within a borough, followed by a similar analysis for every borough subsection. The focus then turns to patterns of residence by neighborhood within the borough, with the foreign-born population mapped and tabulated for each neighborhood. Neighborhoods with large immigrant populations are examined in greater detail, with top countries of birth tabulated.
The chapter concludes with an examination of the patterns of residence of New York City’s largest immigrant groups, as well as for three regional groupings with significant populations, focusing on their borough distribution and top neighborhoods of settlement.
Overview of Patterns of Residence of the Foreign-born Population
Borough Distribution of the Foreign-born
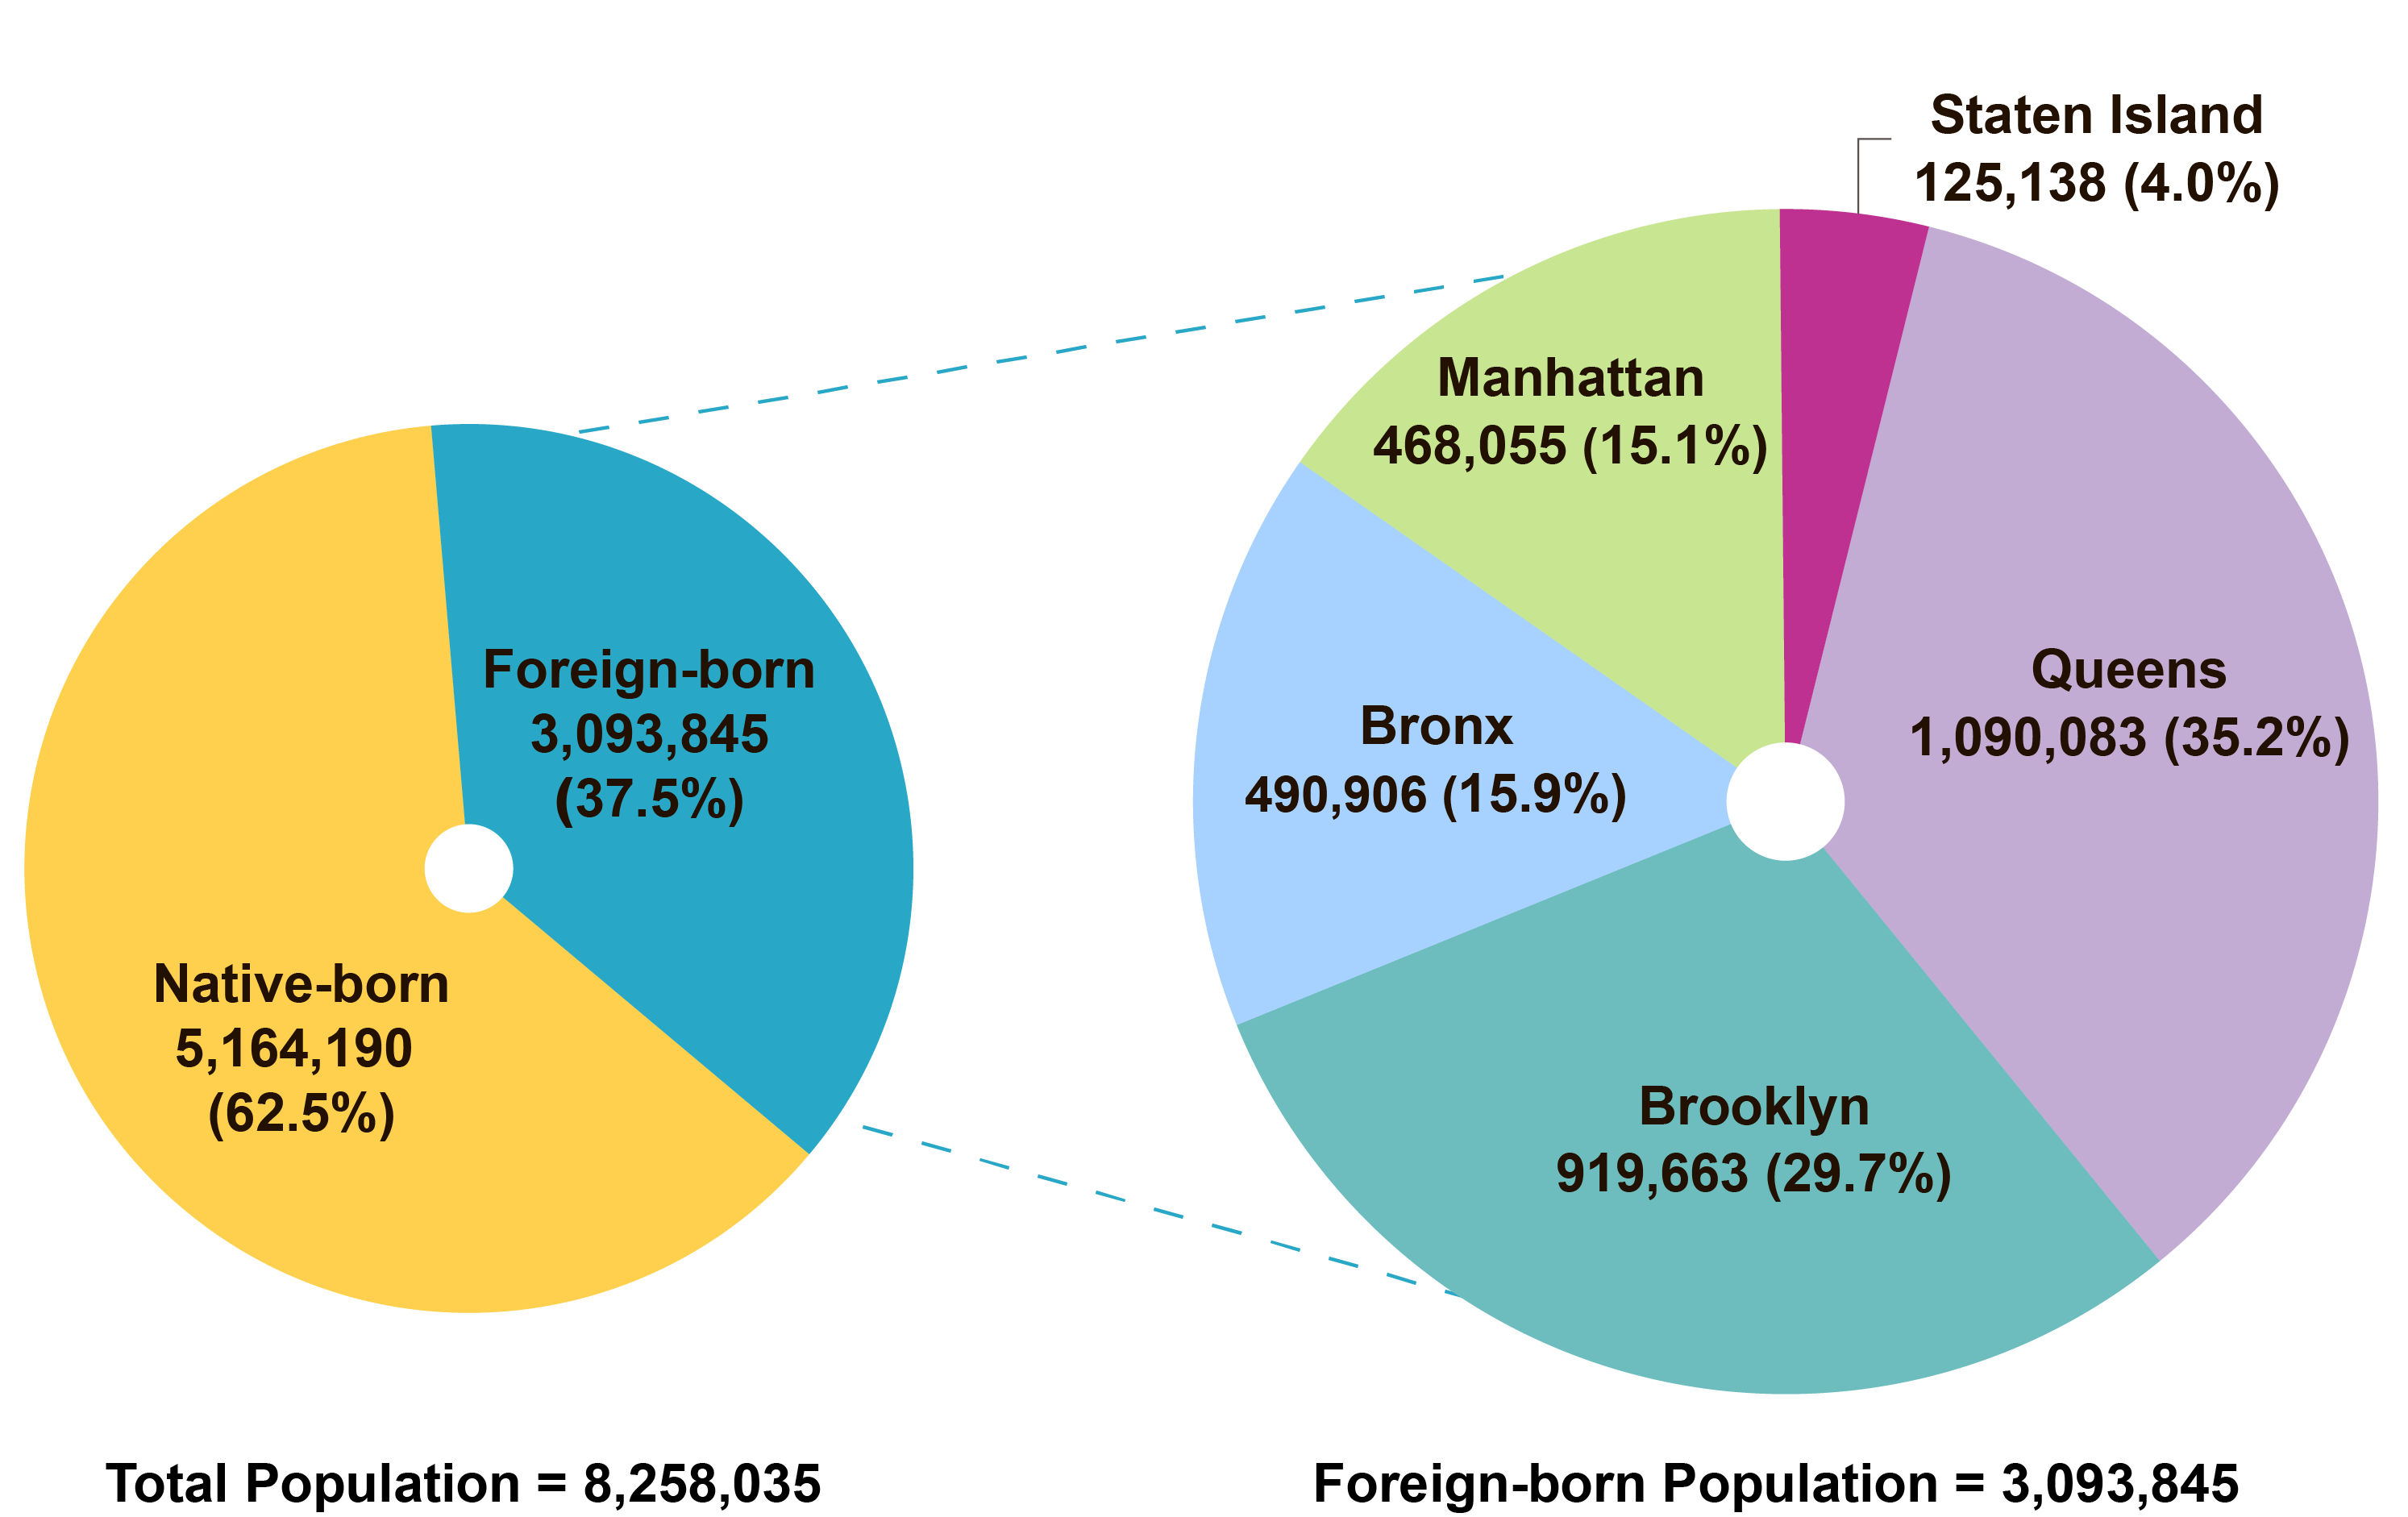
In 2023, New York City had nearly 3.1 million immigrant residents. Of these, 1,090,100 lived in Queens, while 919,700 lived in Brooklyn (Figure 3.1), which together accounted for close to two-thirds of the city’s immigrant population. The foreign-born population of the Bronx and Manhattan totaled 490,900 and 468,100, respectively, each comprising over 15 percent of the overall foreign-born population. Staten Island was home to 125,100 immigrants, making up 4 percent of the city total.
Over the decade 2013 to 2023, the size of New York City’s immigrant population was largely unchanged at 3.1 million (Table 3.1), a contrast with the prior decade which showed a large increase in the foreign-born (see discussion in Chapter 2). While the foreign-born populations in the Bronx, Manhattan, and Queens were relatively unchanged in overall size, Brooklyn experienced a decline. Though small, Staten Island was the only borough whose immigrant population increased significantly over the past decade.
To analyze patterns of immigrant residence by neighborhood, we first need to geographically define neighborhoods, whose boundaries are often subjective and unofficial. This report uses a modified version of Neighborhood Tabulation Areas (NTAs) to approximate the neighborhoods with which New Yorkers are familiar. NTAs were created by combining whole census tracts; NTA-level estimates were produced by aggregating the associated census tract-level American Community Survey (ACS) data.
NTAs were originally created by the NYC Department of City Planning to project populations for small areas. Since population size affects the error associated with both population projections and estimates produced by ACS data, these geographic units were designed to have a minimum population of 15,000. In many instances, two or more smaller neighborhoods were combined into a single NTA to reach this population threshold. Following the 2020 Census, NTAs were modified to correspond to current census tract boundaries and fit within approximations of NYC Community District (CD) boundaries, thus providing data for standardized sub-portions of each CD. In some instances, larger neighborhoods were split into two or more NTAs to fit into either side of a CD boundary or to provide additional granularity below the CD level.
In this report, some NTAs have been combined to make the geographies more relatable. For example, “Bushwick (West)” and “Bushwick (East)”—sub-portions of Brooklyn CD 4—have been combined to form a single NTA called “Bushwick.” This report utilizes 164 NTAs, fewer than the 197 original NTAs because of these combinations. These NTAs are referred to as neighborhoods throughout the chapter and are meant to provide broad reference points to analyze the residential settlement of immigrants.
Some analyses required an intermediate geographic unit, between the borough and neighborhood levels. Standardized borough subsections were created for this purpose and are largely combinations of neighborhoods across multiple approximations of CDs. Queens, for example, has four borough subsections: Northwest, Northeast, Southwest, and Southeast.
Neighborhood-level data are only available using five years of ACS data, which represent an average for a characteristic—for example, the number of residents born in a specific country—over a five-year period. Neighborhood-level data on immigrants are from the 5-year 2019-2023 ACS and are presented alongside comparable 5-year estimates for their respective boroughs. However, more recent data from the 1-year 2023 ACS are also available for the city and the boroughs. Consequently, figures and tables presenting data exclusively for the city and boroughs, particularly those examining changes over the prior decade, rely on the 1-year 2023 and 2013 ACS. City and borough totals derived from the 2023 ACS may vary considerably from those originating from the 2019-2023 ACS. Further, all ACS estimates are subject to sampling error. Therefore, differences between ACS estimates may not be statistically significant.
Statistically unreliable estimates are displayed in gray in tables throughout the chapter.
Neighborhoods with Large Immigrant Populations
Although immigrants were dispersed throughout the city, Figure 3.3 shows that a few neighborhoods had large foreign-born populations, and these were primarily located in Queens and Brooklyn. Flushing-Murray Hill in Northeastern Queens was home to over 95,700 foreign-born residents, while East Flatbush and Gravesend in Brooklyn had 74,600 and 68,600 foreign-born residents, respectively (see Figure 3.2 for a neighborhood reference map). Other large immigrant neighborhoods included Elmhurst, Washington Heights, and Corona, each with around 65,000 foreign-born residents.
There were nine neighborhoods with between 45,000 and 60,000 immigrants including Sunset Park, Jackson Heights, Bensonhurst, Astoria, the Upper East Side, the Upper West Side, East New York, South Ozone Park, and Flatbush. Notable immigrant populations were also found in University Heights-Morris Heights (42,300) in the Bronx, and in Grasmere-Arrochar-South Beach-Dongan Hills and New Springville-Willowbrook-Bulls Head-Travis in Staten Island, each with around 13,000 foreign-born residents.
Neighborhoods with High Immigrant Densities
While the above analysis focused on the number of immigrants in each neighborhood, this section examines the share that immigrants constitute of the overall population of a neighborhood.
Immigrants comprising a large share of the population is a defining feature of what makes a neighborhood an immigrant enclave. Neighborhoods with a high share of immigrants are referred to as having high immigrant concentrations or densities. Consider the difference in the foreign-born populations of the Upper East Side in Manhattan and Woodside in Queens: Nearly 51,000 immigrants lived on the Upper East Side, which is more than the entire population of Woodside; however, foreign-born residents were less than one-quarter of the Upper East Side’s total population of 212,300. While Woodside is a much smaller neighborhood of 47,900 residents, immigrants made up 60 percent of the population. In neighborhoods such as Woodside, where immigrants constituted a large share of the overall population, the level of concentration means that the foreign-born population of the neighborhood often plays a more prominent role in all aspects of the neighborhood’s character.
Queens stood out for having high immigrant concentrations across the borough, with few neighborhoods under one-third foreign-born (Figure 3.4). Even within this context, the 7-train subway corridor running through Northwestern Queens to Flushing stood out prominently as having one of the most substantial concentrations of immigrants in the city, with a string of neighborhoods from Woodside to Flushing having immigrant shares ranging from just over one-half to about two-thirds. Other neighborhoods in the vicinity also had majority-immigrant populations, including Rego Park and College Point. In Southeastern Queens, another notable corridor with majority-immigrant populations was located along Hillside Avenue and the Van Wyck Expressway, including Jamaica, Richmond Hill, Woodhaven, South Ozone Park, Jamaica Hills-Briarwood, Jamaica Estates-Holliswood, and Queens Village. Brooklyn had many of the city’s other neighborhoods with high concentrations of foreign-born residents. Unlike Queens, where neighborhoods with high immigrant concentrations were found across the borough, there was more of a geographic divide in Brooklyn. The Northern and Western portions of the borough closest to Manhattan had lower immigrant densities, while the Central, Eastern, and especially Southern subsections of Brooklyn had high concentrations.
Brighton Beach stood out for its high immigrant density, with the foreign-born comprising 71 percent of the population, compared to 67 percent for Flushing-Murray Hill. (It is worth noting that the total number of foreign-born residents in Brighton Beach was less than one-quarter that of Flushing-Murray Hill.) Nearby, Southern Brooklyn neighborhoods of Gravesend, Bensonhurst, and Bath Beach each had majority-immigrant populations, with the N- and D-train subway lines serving an analogous role to the 7-train in northwestern Queens. Indeed, Southern Brooklyn was the only area of the city outside of Queens with immigrant-majority neighborhoods.
In the Bronx, the highest immigrant concentrations were in the Northern and Western parts of the borough, with foreign-born shares ranging from one-third to 47 percent. Manhattan neighborhoods had immigrant densities that were below the city average, with the most notable exception being Chinatown, where immigrants made up nearly one-half of the population; in Upper Manhattan, Washington Heights and Inwood were each more than 40 percent foreign-born. Staten Island had fewer immigrants at lower concentrations than other boroughs, with Rosebank-Shore Acres-Park Hill and Grasmere-Arrochar-South Beach-Dongan Hills on the eastern side of the island having the highest immigrant densities in the borough, at over one-third foreign-born.
Major Immigrant Neighborhoods and Shifting Patterns of Immigrant Settlement
Note: Categories in this map refer to statistically significant changes in the foreign-born population at a 90 percent confidence level.
Neighborhoods that have both a large number of immigrants, as well as high immigrant concentrations, are defined as major immigrant neighborhoods. To qualify as a major immigrant neighborhood in this chapter, foreign-born density had to exceed the city average—a threshold of 40 percent was used—and the 20 neighborhoods with the largest foreign-born populations were then selected (Table 3.2). These major, or “top,” immigrant neighborhoods were home to over 1 million immigrants, or nearly one-third of the city total, with immigrants comprising an average share of over 50 percent.
Flushing-Murray Hill stood out for being the neighborhood with by far the largest immigrant population, as well as having a very high immigrant density, with the foreign-born accounting for two-thirds of the population. Flushing-Murray Hill’s large immigrant population has remained relatively unchanged in size over the last decade (Figure 3.5).
But many other major immigrant neighborhoods in Queens have had declines in their foreign-born populations, including Jackson Heights and Elmhurst. The largest decline in Queens was in Astoria, which experienced a decrease of 11,000 foreign-born residents (data not shown). This was accompanied by a large increase in native-born residents, resulting in a drop in foreign-born densities to around the city average. Consequently, Astoria dropped out of the list of major immigrant neighborhoods in the city, despite being home to a large number of foreign-born residents.
While more established immigrant enclaves have seen their foreign-born numbers drop, the immigrant population in Queens has spread across a wider range of neighborhoods, resulting in strong growth in some outlying areas. Several neighborhoods in Southeastern Queens near JFK International Airport, including Springfield Gardens, Baisley Park, and St. Albans formed an emerging center of foreign-born growth (Figure 3.5). Together with the large immigrant hubs of South Ozone Park, Jamaica, and Richmond Hill, they form an expanding cluster of immigrant communities across this section of Queens.
As in Queens, there were decreases in the foreign-born populations of many major immigrant neighborhoods in Brooklyn, including a swath running across the center of Brooklyn—from Sunset Park through Flatbush, East Flatbush, and Canarsie. Sunset Park had a decline of 13,000 foreign-born residents, the largest in the city. In East Flatbush, immigrants no longer formed a majority of the population as they did a decade ago. The foreign-born population also declined in other immigrant neighborhoods within this section of Brooklyn, including Borough Park, Prospect Lefferts Gardens-Wingate, Crown Heights, and Flatlands. In Northern Brooklyn, Bushwick had a large immigrant population despite the fact that immigrants made up a below average share of its total. But Bushwick’s large foreign-born population fell by one-quarter over the decade, a decrease of about 12,000 immigrants.
While the major immigrant neighborhoods in Central Brooklyn experienced declines in their foreign-born populations, East New York, a neighborhood to the east with a low foreign-born density, had a significant increase in immigrant residents. In addition, Gravesend, in Southern Brooklyn, was one of the few major immigrant neighborhoods to experience a significant increase, becoming majority immigrant. Gravesend’s immigrant population in the 2019-2023 period was in the same range as some of the city’s longstanding immigrant neighborhoods such as Elmhurst, Washington Heights, and Sunset Park. There were also substantial increases in the foreign-born population nearby in Coney Island and Sheepshead Bay, solidifying Southern Brooklyn’s role as one of the city’s largest immigrant hubs.
In neighborhoods along the East River, including Downtown Brooklyn-DUMBO, Williamsburg, and Long Island City-Hunters Point, as well as farther inland in Bedford-Stuyvesant, new housing development accommodated population growth, including rising foreign-born populations.
Washington Heights, the only Manhattan neighborhood to make the list of major immigrant neighborhoods (Table 3.2), experienced a decline in the foreign-born as did adjacent Inwood. In Lower Manhattan, Chinatown-Two Bridges also experienced a reduction in its immigrant population. In contrast, many neighborhoods in Manhattan’s core that have not traditionally been among the top immigrant population centers experienced significant growth in their foreign-born populations, including Hell’s Kitchen, Chelsea-Hudson Yards, Murray Hill-Kips Bay, the Upper East Side, and Harlem. University Heights-Morris Heights was the only Bronx neighborhood to make the list of major immigrant neighborhoods in the city. None of the major immigrant neighborhoods were located on Staten Island, despite the borough’s foreign-born population increase.
While many large immigrant enclaves in the city have experienced declines in the foreign-born, growth in immigrant residents across a broader range of neighborhoods has helped stabilize the city’s overall immigrant population. With immigrants increasingly establishing themselves in new locations, they are shaping an even wider swath of neighborhoods across each borough.
The next section surveys each borough, and subsections within each borough, and details the major areas of origin and countries of birth of their foreign-born populations. Top countries of origin are also examined for neighborhoods with large immigrant populations or densities.
The Bronx
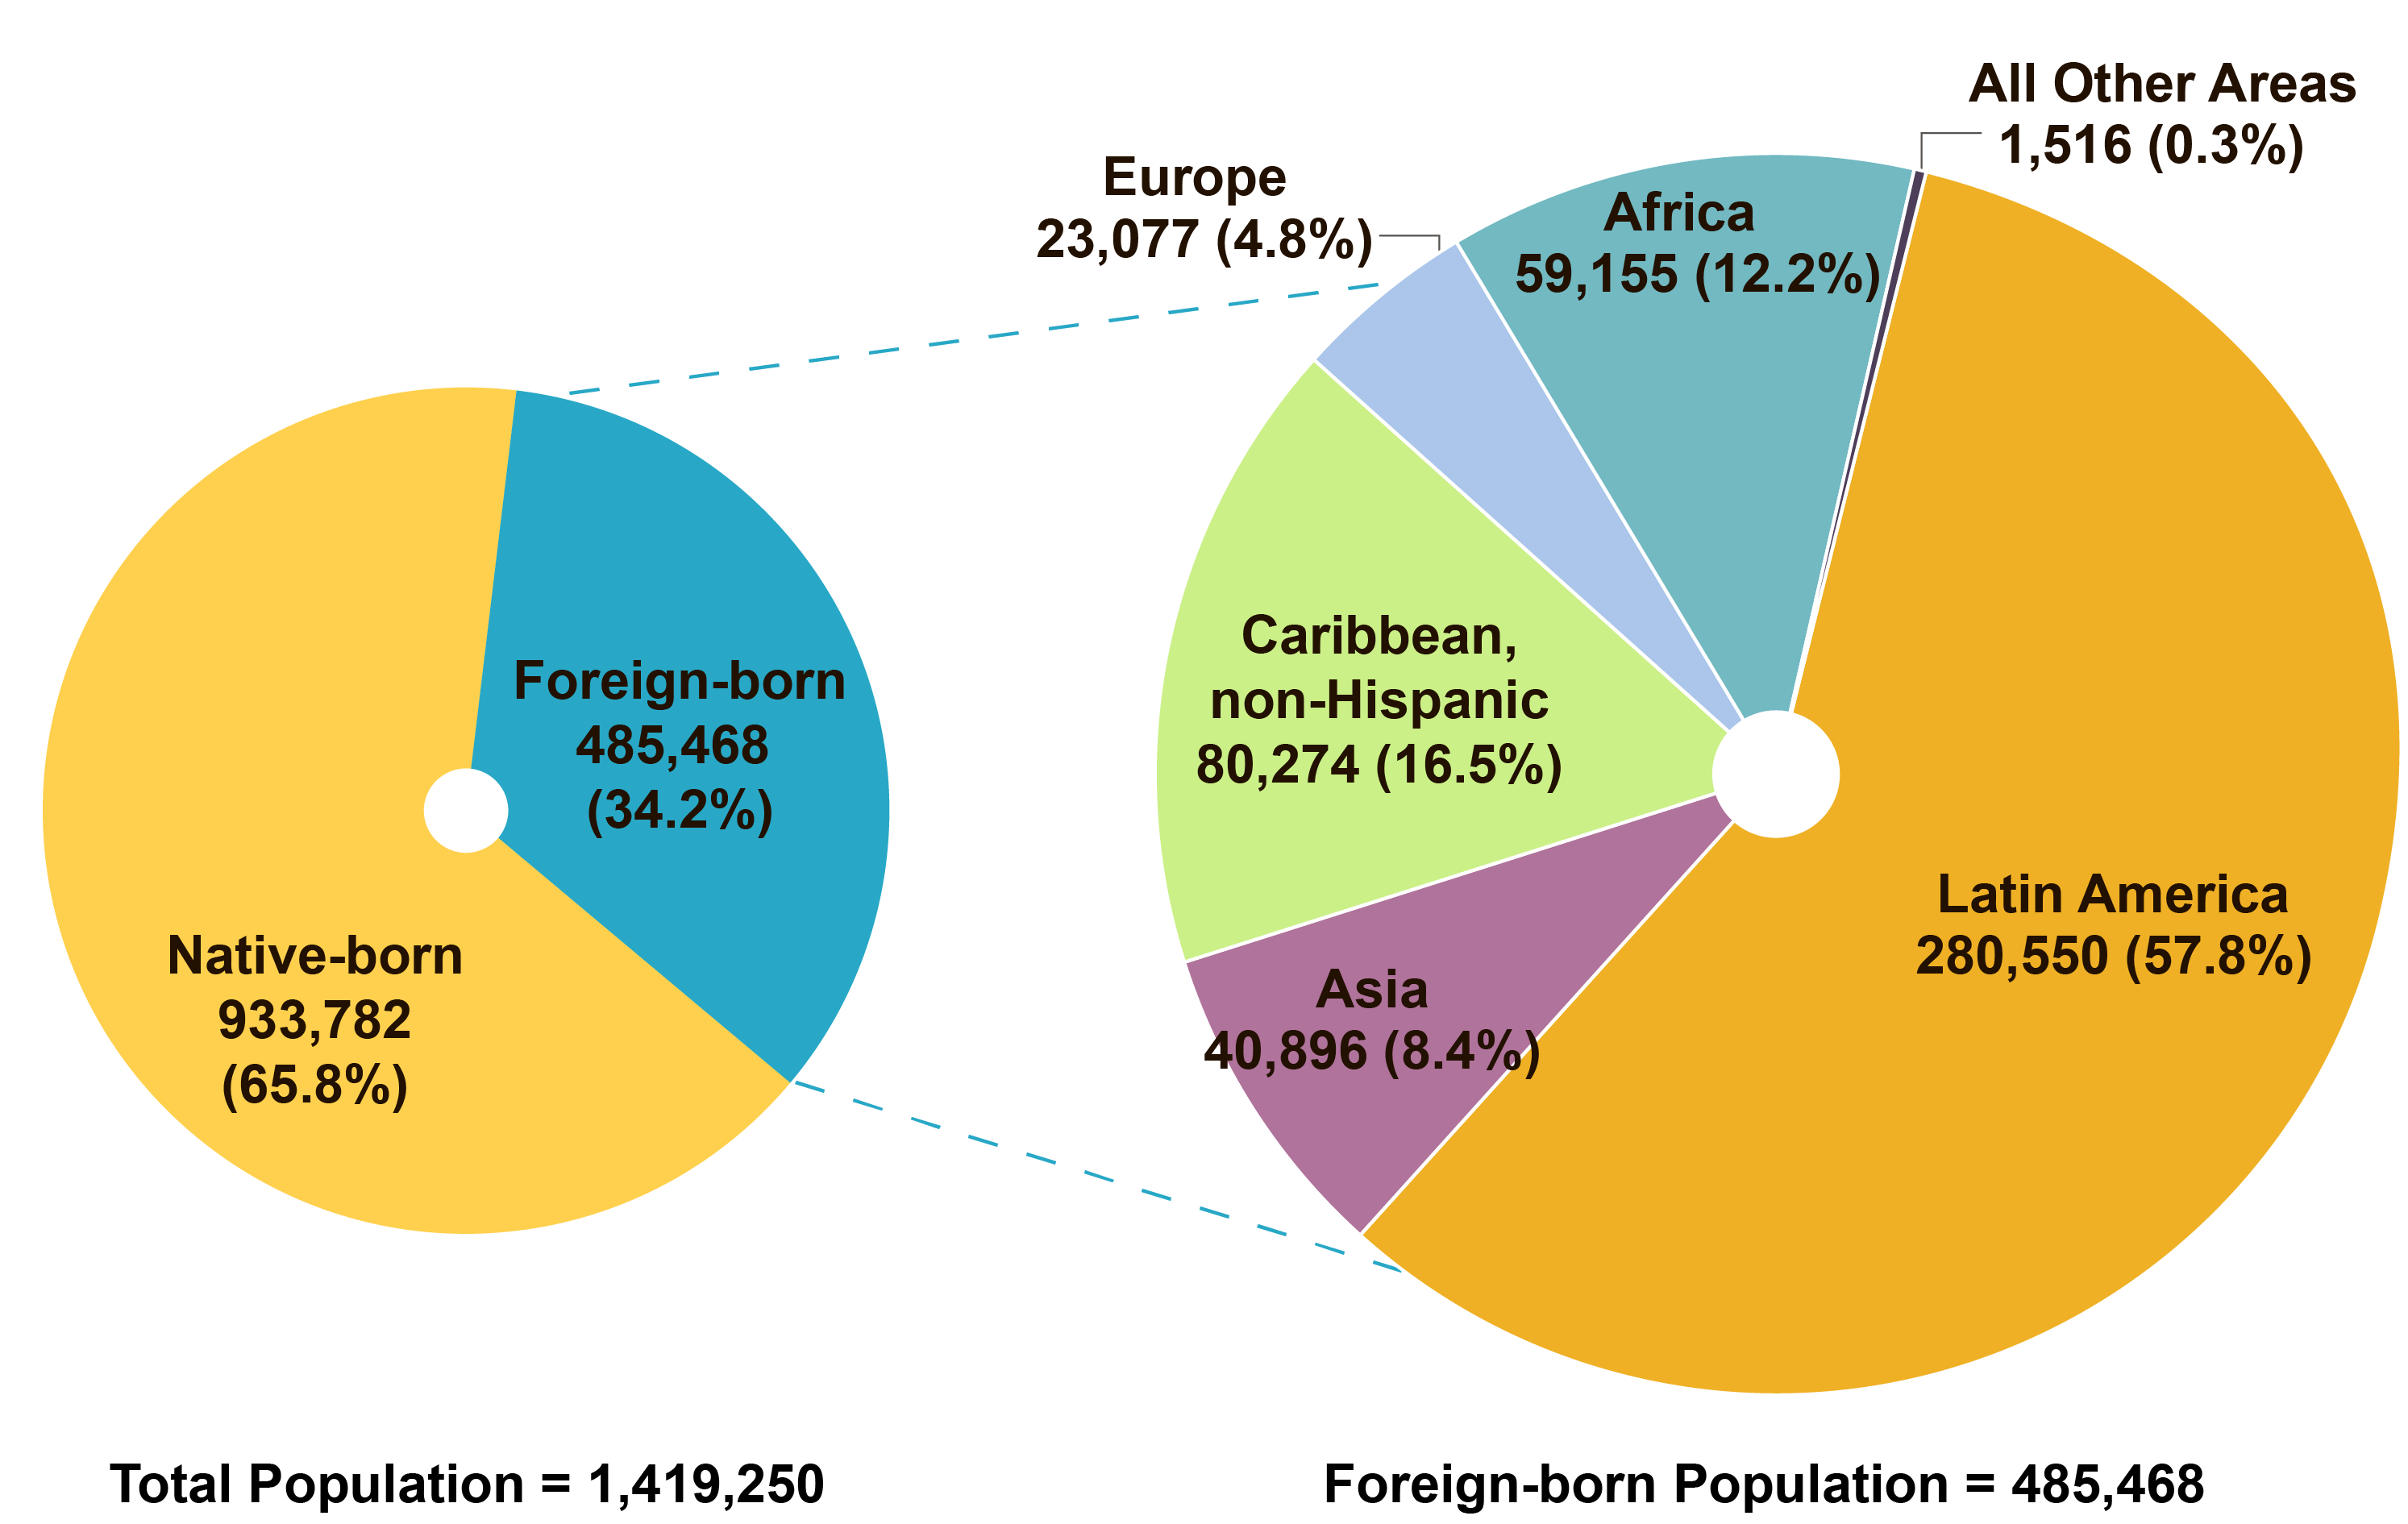
The Bronx had a foreign-born population totaling 485,500, which comprised over one-third of the borough’s population. Immigrants from Latin America were the largest group in the Bronx, accounting for 58 percent of the borough’s foreign-born population (Figure 3.6), compared to one-third citywide. Non-Hispanic Caribbean immigrants accounted for 17 percent, those from Africa for 12 percent, while the shares for Asian and European immigrants were in the single digits. In addition to Latin Americans, Africans also had a disproportionately large presence in the Bronx—their 12 percent share was more than twice the 5 percent they comprised of the citywide foreign-born population. In contrast, non-Hispanic Caribbean immigrants had a relatively smaller presence in the borough, compared to their share citywide, as did Asians and Europeans.
Turning to the countries of origin (Table 3.3), the Dominican Republic accounted for about 39 percent of all immigrants in the Bronx; all other countries of origin had a share in the single digits. The Dominican Republic was followed by Jamaica, Mexico, and Ghana. These four countries together accounted for nearly 60 percent of the borough’s foreign-born population. Immigrants from Bangladesh, Ecuador, Guyana, and Honduras also had notable populations, each with more than 12,000 residents.
Bronx Subsections and Neighborhoods
To provide a snapshot of the origins of the foreign-born population across the Bronx, the borough was divided into four parts or borough subsections. Figure 3.7 shows these four geographic components—South Bronx, Western Bronx, Northern Bronx, and Eastern Bronx—along with the area of origin and top source countries. The accompanying Table 3.4 shows the total and foreign-born populations in each borough subsection, as well as the distribution of the foreign-born population by area of origin.
The Western subsection of the borough had 180,100 immigrants, and there was a notable foreign-born presence in the Eastern subsection (126,400), the South Bronx (120,300), and the Northern subsection (62,000). The Western Bronx also had a high concentration of immigrants, who comprised 39 percent of the population, nearly 5 percentage points higher than their overall share in the borough. Although the Northern Bronx had a relatively small number of foreign-born residents, it matched the Western Bronx in terms of an above-average concentration of immigrants (39 percent). Conversely, the South and Eastern Bronx fell below the borough average, with immigrants comprising 31 percent of the populations of each subsection.
Immigrants from Latin America had the predominant share of the foreign-born population in both the South Bronx and Western Bronx. By contrast, immigrants from non-Hispanic Caribbean countries were the overwhelming majority in the Northern Bronx. The Eastern Bronx had higher shares of Asian and European immigrants than other borough subsections, though Latin Americans still made up nearly one-half of the immigrant population. Immigrants from Africa had a notable presence in each part of the borough, but were most prominent in the South Bronx.
Note: Borough subsection values do not sum to borough totals because Marble Hill is located in the borough of Manhattan but is part of the Western Bronx subsection for this analysis. See Box 3.2 for more details.
Marble Hill, with total and foreign-born populations of 10,529 and 3,314, respectively, is located in the borough of Manhattan but is part of Bronx Community District 8 and the Kingsbridge-Marble Hill neighborhood in the Western Bronx subsection. Thus, when Bronx subsections are summed, the total is higher than the actual Bronx borough total. The neighborhood and subsection shares of the Bronx’s total and foreign-born populations are calculated using these higher totals of 1,429,779 and 488,782, respectively.
For a neighborhood-focused analysis within each subsection, Figure 3.8 maps the foreign-born by neighborhood, Table 3.5 shows the total and immigrant population of each neighborhood, while Table 3.6 examines the top source countries for selected neighborhoods.
Some of the largest immigrant neighborhoods in the Bronx spanned the South Bronx and the Western parts of the borough, roughly following the major transportation corridors of the Grand Concourse and Jerome Avenue. These neighborhoods include Concourse, Claremont-Mount Eden, University Heights-Morris Heights, Mount Hope, and Bedford Park, each with more than 20,000 foreign-born residents. Also notable as part of this grouping were neighborhoods such as Fordham Heights and Norwood, with smaller but high-density immigrant populations (comprising over 45 percent of their total populations). In the Northern Bronx, both Williamsbridge and Wakefield-Woodlawn had more than 20,000 foreign-born residents. Soundview, in the Eastern part of the borough, had 33,200 immigrant residents, while the much smaller neighborhood of Westchester Square stood out for its high proportion of immigrants, over 43 percent foreign-born.
Neighborhoods are next examined in greater detail within each borough subsection.
South Bronx
The South Bronx was home to 120,300 immigrants, or around one-quarter of the immigrants in the borough (Table 3.4). Immigrants were slightly underrepresented in this part of the borough, comprising 31 percent of the population, compared to 34 percent in the borough overall. Those from Latin America accounted for 70 percent of the foreign-born population in the South Bronx, while the growing African immigrant population accounted for almost 18 percent. The Dominican Republic was by far the largest country of origin, alongside several other Latin American countries including Mexico, Ecuador, and Honduras (Table 3.6). Ghanaians were the most numerous African group in the South Bronx.
Concourse and Claremont-Mount Eden, situated along the Grand Concourse, had both large immigrant populations as well as high shares of immigrants in this part of the borough. Immigrants from the Dominican Republic comprised a majority of the foreign-born in Claremont-Mount Eden and had a 41 percent share in Concourse, followed by Mexicans and Ghanaians in both of these neighborhoods, mirroring the composition in the South Bronx as a whole. The Ghanaian populations in Concourse and Claremont-Mount Eden were part of a larger concentration running through several neighborhoods along the Grand Concourse and into the Western Bronx. Ecuadorians and Jamaicans made up smaller portions of the immigrant populations of these neighborhoods as well.
Western Bronx
The Western part of the Bronx had a large number of immigrants (180,100), who comprised nearly 4-in-10 residents. Latin Americans accounted for nearly three-quarters of the foreign-born population, while immigrants from Africa were nearly 11 percent. The top countries of origin were the same as in the South Bronx, with Dominicans being the most prominent group overall, followed by Mexicans, Ghanaians, Ecuadorians, and Hondurans.
The Dominican population of the Western Bronx was buoyed by the flow directly from the Dominican Republic, as well as from neighborhoods such as Washington Heights in Manhattan. Dominicans accounted for nearly two-thirds of the immigrant population of University Heights-Morris Heights, a majority of the foreign-born in Mount Hope, Fordham Heights, Bedford Park, and Kingsbridge Heights-Van Cortlandt Village, as well as a large plurality in Norwood. The prominence of Dominicans in these neighborhoods is especially striking, considering that most other countries of origin had shares in the single digits.
Mexicans tended to be among the top immigrant groups in most Western Bronx neighborhoods, with roughly a 10 percent share of the immigrant population in Norwood and Bedford Park. Ghanaians had a notable presence in Mount Hope, with a 14 percent share of the foreign-born population, and a smaller presence in other neighborhoods along the Grand Concourse. Bangladeshis constituted almost 10 percent of the foreign-born population in Norwood. Immigrants from Ecuador and Honduras were also among the top groups in Western Bronx neighborhoods.
Note 1: Only residential neighborhoods are included in this table. Neighborhoods may not sum to borough subsection totals because subsection totals also include small populations present in large parks and other non-residential areas.
Note 2: Borough subsection values do not sum to borough totals because Marble Hill is located in the borough of Manhattan but is part of the Western Bronx subsection for this analysis. See Box 3.2 for more details.
Northern Bronx
The Northern Bronx, the borough’s smallest subsection, was home to 62,000 immigrants or just 13 percent of the foreign-born population of the borough. However, immigrants made up a large share (39 percent) of the overall population in this subsection. In a deviation from the rest of the borough, immigrants from the non-Hispanic Caribbean were the majority group among the foreign-born, with a 59 percent share. Latin Americans comprised 21 percent and African immigrants had a substantial 14 percent share. Jamaica was the most common country of origin, though Dominicans maintained a significant presence, along with Guyana, Ghana, and Nigeria.
Jamaicans comprised a majority of the foreign-born population in Eastchester-Edenwald-Baychester, numbering 9,900, while Dominicans accounted for approximately 10 percent. In Williamsbridge and Wakefield-Woodlawn, Jamaicans were again the largest group with a one-third share; Dominican and Guyanese immigrants also had a substantial presence. Immigrants from the West African countries of Ghana and Nigeria, as well as Mexico, also had a small presence in these neighborhoods. Irish immigrants, who a decade ago had a major presence in Wakefield-Woodlawn, have fallen out of the top five as Irish flows to the city have declined from their spurts in the 1980s and 1990s (data not shown).
Eastern Bronx
The Eastern part of the Bronx had 126,400 immigrants or around one-quarter of the borough total. Latin Americans were the largest group among immigrants in the Eastern Bronx, but with a smaller share (45 percent) than in the South and Western subsections of the borough. Immigrants from Asia and the non-Hispanic Caribbean constituted 20 and 18 percent shares of the foreign-born, respectively. Around 9 percent of immigrants in this part of the borough were from Europe and 8 percent were from Africa. The Dominican Republic was the top country of origin (26 percent) among Latin American groups in the Eastern Bronx, while Bangladesh (10 percent) made up a substantial portion of the Asian foreign-born population. The next largest groups were Jamaicans followed by Mexicans and Ecuadorians.
In Soundview and Allerton, Dominicans comprised 37 percent and 29 percent, respectively, of the immigrant population; Mexicans had a presence in Soundview and Jamaicans in Allerton, but both had shares under 10 percent. Allerton was unusual in that a European country (Albania) was in the top five. Westchester Square, a comparatively small neighborhood, but with a disproportionately large and growing foreign-born population, is also distinct in that the top country of origin was in Asia—Bangladesh, which comprised 30 percent of the foreign-born population. Dominican, Mexican, Ecuadorian, and Guyanese immigrants were some of the other top groups in these neighborhoods.
Brooklyn
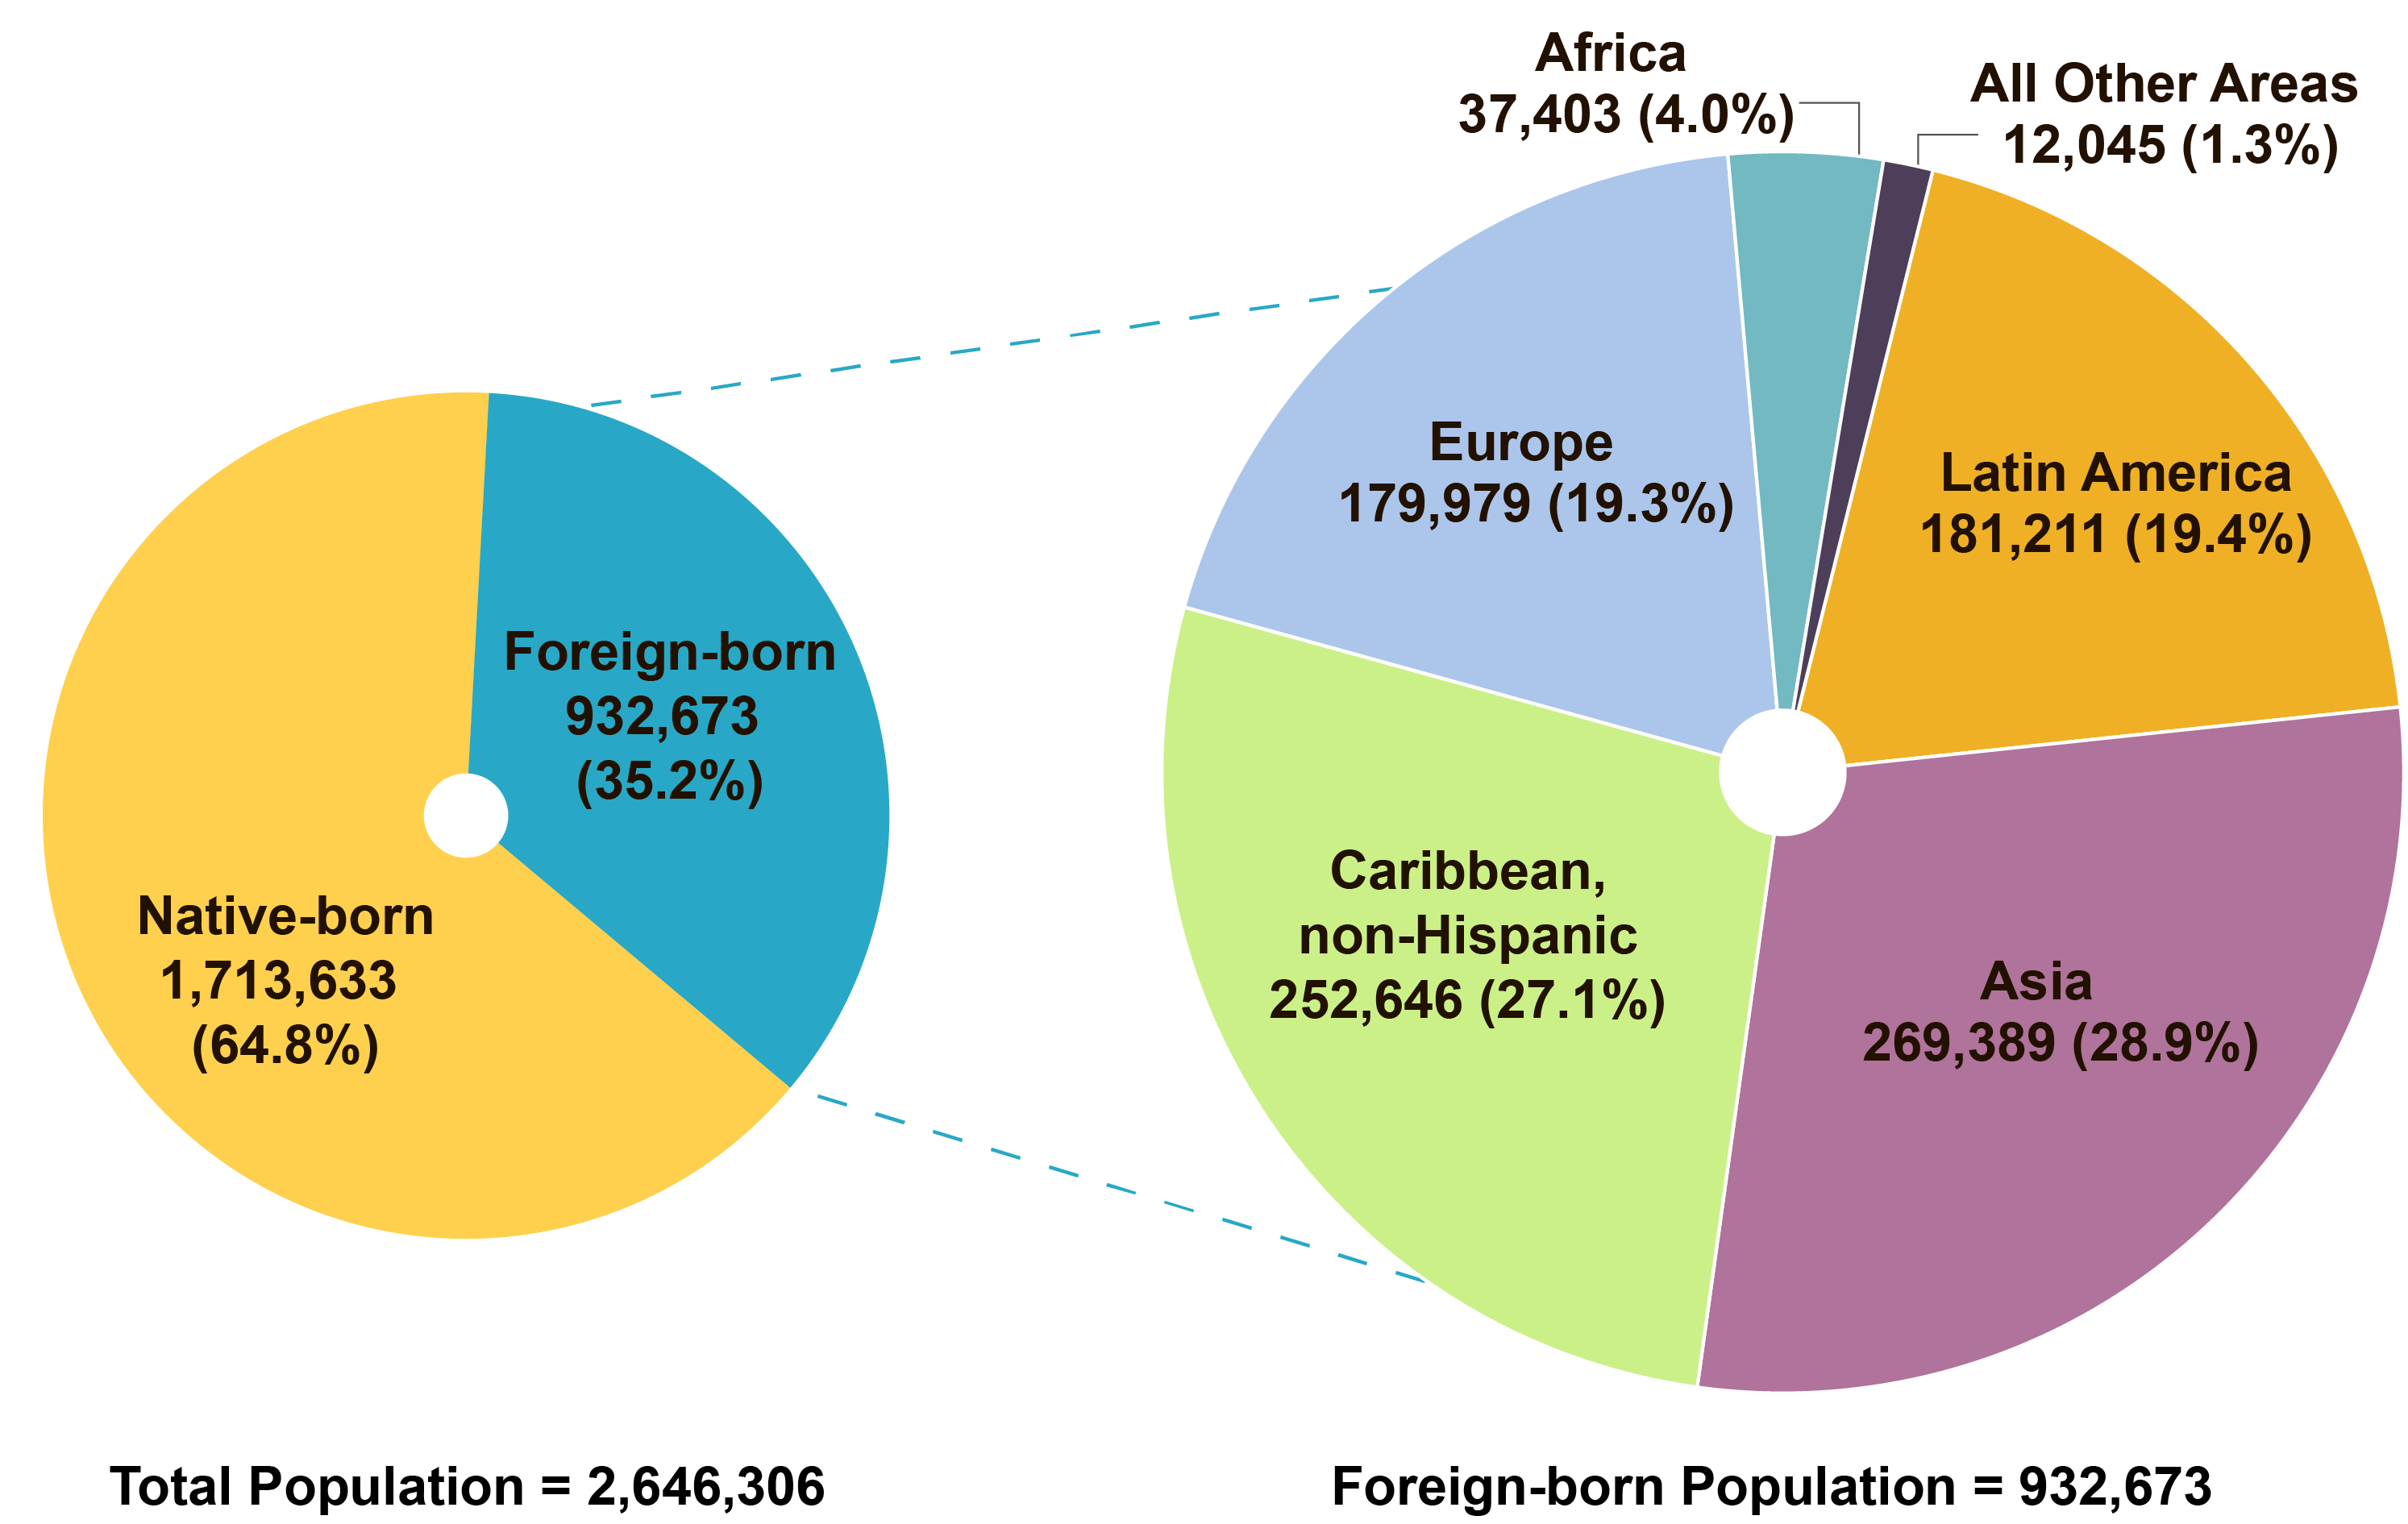
Brooklyn was home to 932,700 immigrant residents, who accounted for 35 percent of the borough’s total population (Figure 3.9). It had the second-largest immigrant population among the boroughs—surpassed only by Queens. As noted earlier, while Brooklyn’s foreign-born population declined over the past decade, the decrease was not substantial.
Asia and the non-Hispanic Caribbean were the top areas of origin among Brooklyn’s immigrants, together accounting for over one-half of the borough’s foreign-born residents—29 percent and 27 percent, respectively (Figure 3.9)—while immigrants from Latin America and Europe each comprised 19 percent of the foreign-born. Those born in Africa had a smaller presence in Brooklyn, accounting for just 4 percent of immigrants. Non-Hispanic Caribbean and European countries comprised larger shares in Brooklyn than in the city as a whole. By contrast, Latin Americans made up a significantly smaller share of Brooklyn’s foreign-born population compared to their citywide representation—19 percent in Brooklyn versus 32 percent citywide. The shares of Asians and Africans in Brooklyn’s immigrant population were only slightly lower than each of their respective citywide proportions.
China was the leading country of origin among Brooklyn’s immigrant population, with 128,900 residents (Table 3.7), more than twice the number from Jamaica, the next largest source, at 62,900. Dominican, Haitian, and Ukrainian immigrants each comprised at least 5 percent of Brooklyn’s foreign-born population or more than 47,000 residents per country. Immigrants from Trinidad and Tobago, Guyana, and Mexico also had sizable communities in Brooklyn, each accounting for about 4 percent of the borough’s foreign-born, or approximately 40,000 residents.
Brooklyn Subsections and Neighborhoods
Figure 3.10 shows Brooklyn’s five subsections—Northern Brooklyn, Western Brooklyn, Central Brooklyn, Eastern Brooklyn, and Southern Brooklyn—along with the areas of origin and top source countries (Figure 3.10). The accompanying Table 3.8 presents the total and foreign-born populations in each borough subsection, as well as the distribution of the foreign-born population by area of origin.
Southern Brooklyn had the largest immigrant population among Brooklyn subsections, with 325,100 foreign-born residents. These immigrants made up 44 percent of the total population in Southern Brooklyn, higher than the citywide average and the highest share of any borough subsection outside of Queens. Central Brooklyn had 237,500 immigrants, comprising one-third of its total population. Eastern Brooklyn’s foreign-born population was smaller in number (178,700) but accounted for a larger share of the total population (36 percent) than Central Brooklyn. Western and Northern Brooklyn had the smallest immigrant populations, 112,700 and 78,700, respectively.
Immigrant settlement in Brooklyn varied significantly by area of origin. In Northern Brooklyn, Latin Americans were the predominant group, making up 44 percent of the foreign-born population. In Western Brooklyn, Asia was the predominant area of origin at 43 percent, though Latin America still comprised a substantial share at 30 percent. In contrast, non-Hispanic Caribbean immigrants represented only a small portion of the foreign-born in both Northern and Western Brooklyn, but their presence was markedly larger in Central and Eastern Brooklyn, where they constituted the majority—57 percent and 54 percent of the foreign-born, respectively. In Southern Brooklyn, Asians (47 percent) and Europeans (34 percent) were the predominant groups.
For a neighborhood-level analysis within each borough subsection, Figure 3.11 maps the foreign-born by neighborhood, Table 3.9 presents the total and immigrant population of each neighborhood, while Table 3.10 highlights the top source countries for selected neighborhoods.
Several Brooklyn neighborhoods were major immigrant hubs with foreign-born populations above 50,000. These included East Flatbush in Central Brooklyn (74,600), Gravesend and Bensonhurst in Southern Brooklyn (68,600 and 54,500, respectively), as well as Sunset Park in Western Brooklyn (59,500). Immigrants were more than 47 percent of the population in both East Flatbush and Sunset Park, and they comprised a majority in both Gravesend and Bensonhurst. Some of the smaller neighborhoods of Southern Brooklyn also had immigrant majorities or near majorities, most notably Brighton Beach where immigrants made up a staggering 71 percent of all residents—the most of any neighborhood in the city. East New York, though not historically a major immigrant hub, had a foreign-born population close to 50,000, reflecting growth over the prior decade. However, immigrants made up just 35 percent of the neighborhood’s total population. In contrast, nearby Canarsie and Cypress Hills had smaller but more concentrated immigrant populations, with the foreign-born comprising approximately 45 percent of the population in both neighborhoods. Neighborhoods of Northern and Western Brooklyn near the East River tended to have smaller immigrant populations than other neighborhoods in Brooklyn.
Neighborhoods are next examined in greater detail within each borough subsection.
Northern Brooklyn
Northern Brooklyn had the lowest concentration of immigrants among Brooklyn subsections, with its 78,700 foreign-born residents accounting for just one-quarter of the total population. Dominicans comprised 17 percent of the foreign-born population, while those born in China, Mexico, Ecuador, and Poland had shares in the single digits.
In recent decades, the Northern Brooklyn neighborhoods of Williamsburg, Greenpoint, and Bushwick have experienced an influx of native-born residents, particularly as new housing developments have expanded in the area. But these neighborhoods have long had at least a modest immigrant presence. Polish immigrants, for example, have long been concentrated in Greenpoint, and a majority of Northern Brooklyn’s Polish-born residents continue to reside there. The neighborhood with the smallest share of immigrants, however, was South Williamsburg—foreign-born residents comprised less than 10 percent of its overall population (data not shown), the lowest concentration of any neighborhood in New York City. In contrast, Bushwick stood out for both the share of its foreign-born population (31 percent) and its overall size (35,100)—the largest in the subsection on both counts. Bushwick was home to many Latin American immigrants, including a majority of Northern Brooklyn’s Dominican, Ecuadorian, and Mexican populations. Immigrants from China and Guyana also had a substantial presence in the neighborhood.
Western Brooklyn
Western Brooklyn was home to 112,700 immigrants, who made up 28 percent of the overall population. Immigrants from the United Kingdom had a notable presence in Western Brooklyn, totaling 4,000—placing them among the top 5 groups in the area. Many neighborhoods in this part of the borough tended to have predominantly native-born populations, and in most cases, immigrants comprised roughly one-fifth or less of the population. A key exception to these broader patterns was Sunset Park, one of Brooklyn’s most prominent immigrant hubs. The neighborhood had 59,500 foreign-born residents, accounting for over 47 percent of its total population. Nearly one-half of Sunset Park’s immigrant population came from China (27,800), with many concentrated along the blocks surrounding 8th Avenue—often referred to as the heart of “Brooklyn’s Chinatown.” Mexicans also had a significant presence in the neighborhood, with 10,100 residents, and there were substantial numbers of Dominicans, Ecuadorians, and Guatemalans, who were largely concentrated in the western section of Sunset Park, particularly the area around 5th Avenue extending down to 3rd Avenue.
Central Brooklyn
Central Brooklyn was home to almost one-quarter million foreign-born residents (237,500), who made up one-third of the total population. Central Brooklyn neighborhoods included many of the city’s most prominent hubs for non-Hispanic Caribbean immigrants from Jamaica, Haiti, Trinidad and Tobago, Guyana, and Grenada.
East Flatbush was the largest immigrant neighborhood in both Central Brooklyn and the borough overall, with 74,600 foreign-born residents who made up 47 percent of the population. Residents from Jamaica, Haiti, and Trinidad and Tobago numbered more than 10,000 each in East Flatbush, together accounting for a majority of the neighborhood’s immigrant population. Adjacent Flatbush also had a large concentration of non-Hispanic Caribbean immigrants, with substantial numbers of Haitians, Jamaicans, and Trinidadians. The significant presence of Caribbean immigrants has led the city to designate stretches of East Flatbush and Flatbush as “Little Caribbean” and “Little Haiti.” Flatbush was also home to Mexican and Pakistani immigrants who were largely concentrated on the western side of the neighborhood.
The nearby neighborhoods of Crown Heights and Prospect Lefferts Gardens-Wingate also had large numbers of Caribbean-born residents, each with a significant Jamaican presence. Farther south, the immigrant population in Midwood reflected a different pattern. Its 20,100 foreign-born residents were primarily from the former Soviet republics, with Ukraine, Russia, Uzbekistan, and Belarus among the top countries of origin. Pakistanis also had a notable presence in Midwood, forming part of a larger community along Coney Island Avenue.
Note: Only residential neighborhoods are included in this table. Neighborhoods may not sum to borough subsection totals because subsection totals also include small populations present in large parks and other non-residential areas.
Eastern Brooklyn
Eastern Brooklyn was home to 178,700 foreign-born residents, who made up 36 percent of the population—close to the citywide average. The top groups were immigrants from Jamaica, the Dominican Republic, Haiti, and Guyana, reflecting the distinct mix of immigrant origins in neighborhoods across this subsection of Brooklyn. In Canarsie and Flatlands, the countries of origin closely mirrored those of adjacent East Flatbush in Central Brooklyn, with non-Hispanic Caribbean sources predominating. Jamaicans and Haitians were among the top groups in each neighborhood, alongside immigrants from Guyana, Trinidad and Tobago, and Grenada. Immigrant concentrations were slightly lower than in East Flatbush, with the immigrant share at 45 percent in Canarsie and 41 percent in Flatlands.
In Cypress Hills, immigrants made up 45 percent of the population—among the highest in Eastern Brooklyn. Immigrant origins in Cypress Hills reflected the prominent Dominican presence in adjacent parts of Queens and Northern Brooklyn, with Dominicans comprising 41 percent of the foreign-born population.
East New York stood out with 49,900 immigrants—more than any other neighborhood in this subsection of Brooklyn—who made up 35 percent of the population, slightly below the citywide average. The convergence of several subway lines around Broadway Junction parallels the composition of East New York’s foreign-born population—an assemblage of distinct origin groups found in adjacent areas, with populations hailing from the Dominican Republic, Bangladesh, Guyana, Jamaica, and Trinidad and Tobago.
Southern Brooklyn
Southern Brooklyn’s 325,100 foreign-born residents accounted for 44 percent of the total population. China was the top country of origin with 77,000 residents, who made up 24 percent of the immigrant population of Southern Brooklyn. Three former Soviet republics—Ukraine (38,400), Russia (24,800), and Uzbekistan (14,100)—collectively accounted for another 24 percent. Southern Brooklyn’s Mexican-born population was also sizable (13,600), though more geographically dispersed across the subsection.
Chinese immigrants (including those from the mainland, Taiwan, and Hong Kong) were especially concentrated in Dyker Heights and Bensonhurst, where they comprised 53 percent (10,000 residents) and 39 percent (21,400) of the foreign-born population, respectively. These neighborhoods formed the heart of a growing Chinese immigrant corridor along the N and D subway lines, stretching from Sunset Park through Gravesend. Chinese-born residents were also the top immigrant group in the neighboring communities of Bath Beach (36 percent of the foreign-born), Gravesend (26 percent), Madison (25 percent), and Bay Ridge (16 percent). Historically, many of these same neighborhoods had once hosted large Italian immigrant populations. Today, Italian-born residents remain among the largest immigrant groups in Dyker Heights and Bensonhurst. The settlement pattern of Chinese immigrants has, in part, followed the earlier migration route of Italians into these Southern Brooklyn neighborhoods and across the Verrazzano-Narrows Bridge into Staten Island (see Section 3.6).
In addition to Chinese immigrants, Bensonhurst’s foreign-born population was also shaped by a sizable Ukrainian presence. More broadly, immigrants from Ukraine and other former Soviet republics made their home across much of Southern Brooklyn. Brighton Beach—though small in geographic size—served as a major hub for immigrants from a range of countries, including Ukrainians, Russians, Uzbeks, and Georgians, along with a notable Pakistani population. Surrounding neighborhoods such as Sheepshead Bay, Coney Island, and Gravesend also had significant Ukrainian-born populations, each home to roughly 7,500 residents from Ukraine.
In Bay Ridge, Chinese immigrants numbered 4,500 residents, and there was a notable presence of immigrants from Egypt, Mexico, Ukraine, and Yemen. Though China was the largest single country of origin, immigrants from all Arab countries numbered around 6,000 (data not shown), collectively giving them a prominent presence in the neighborhood.
Kensington stood out for its large South Asian immigrant population, particularly Bangladeshis, who numbered around 3,300 and accounted for 23 percent of the neighborhood’s foreign-born. Much of the Bangladeshi community was centered around Church and McDonald Avenues—an intersection officially recognized by the city as “Little Bangladesh.” Kensington also had a notable Pakistani population, particularly on the eastern side of the neighborhood, closer to the broader Pakistani community residing along Coney Island Avenue, sometimes collectively referred to as “Little Pakistan.”
Manhattan
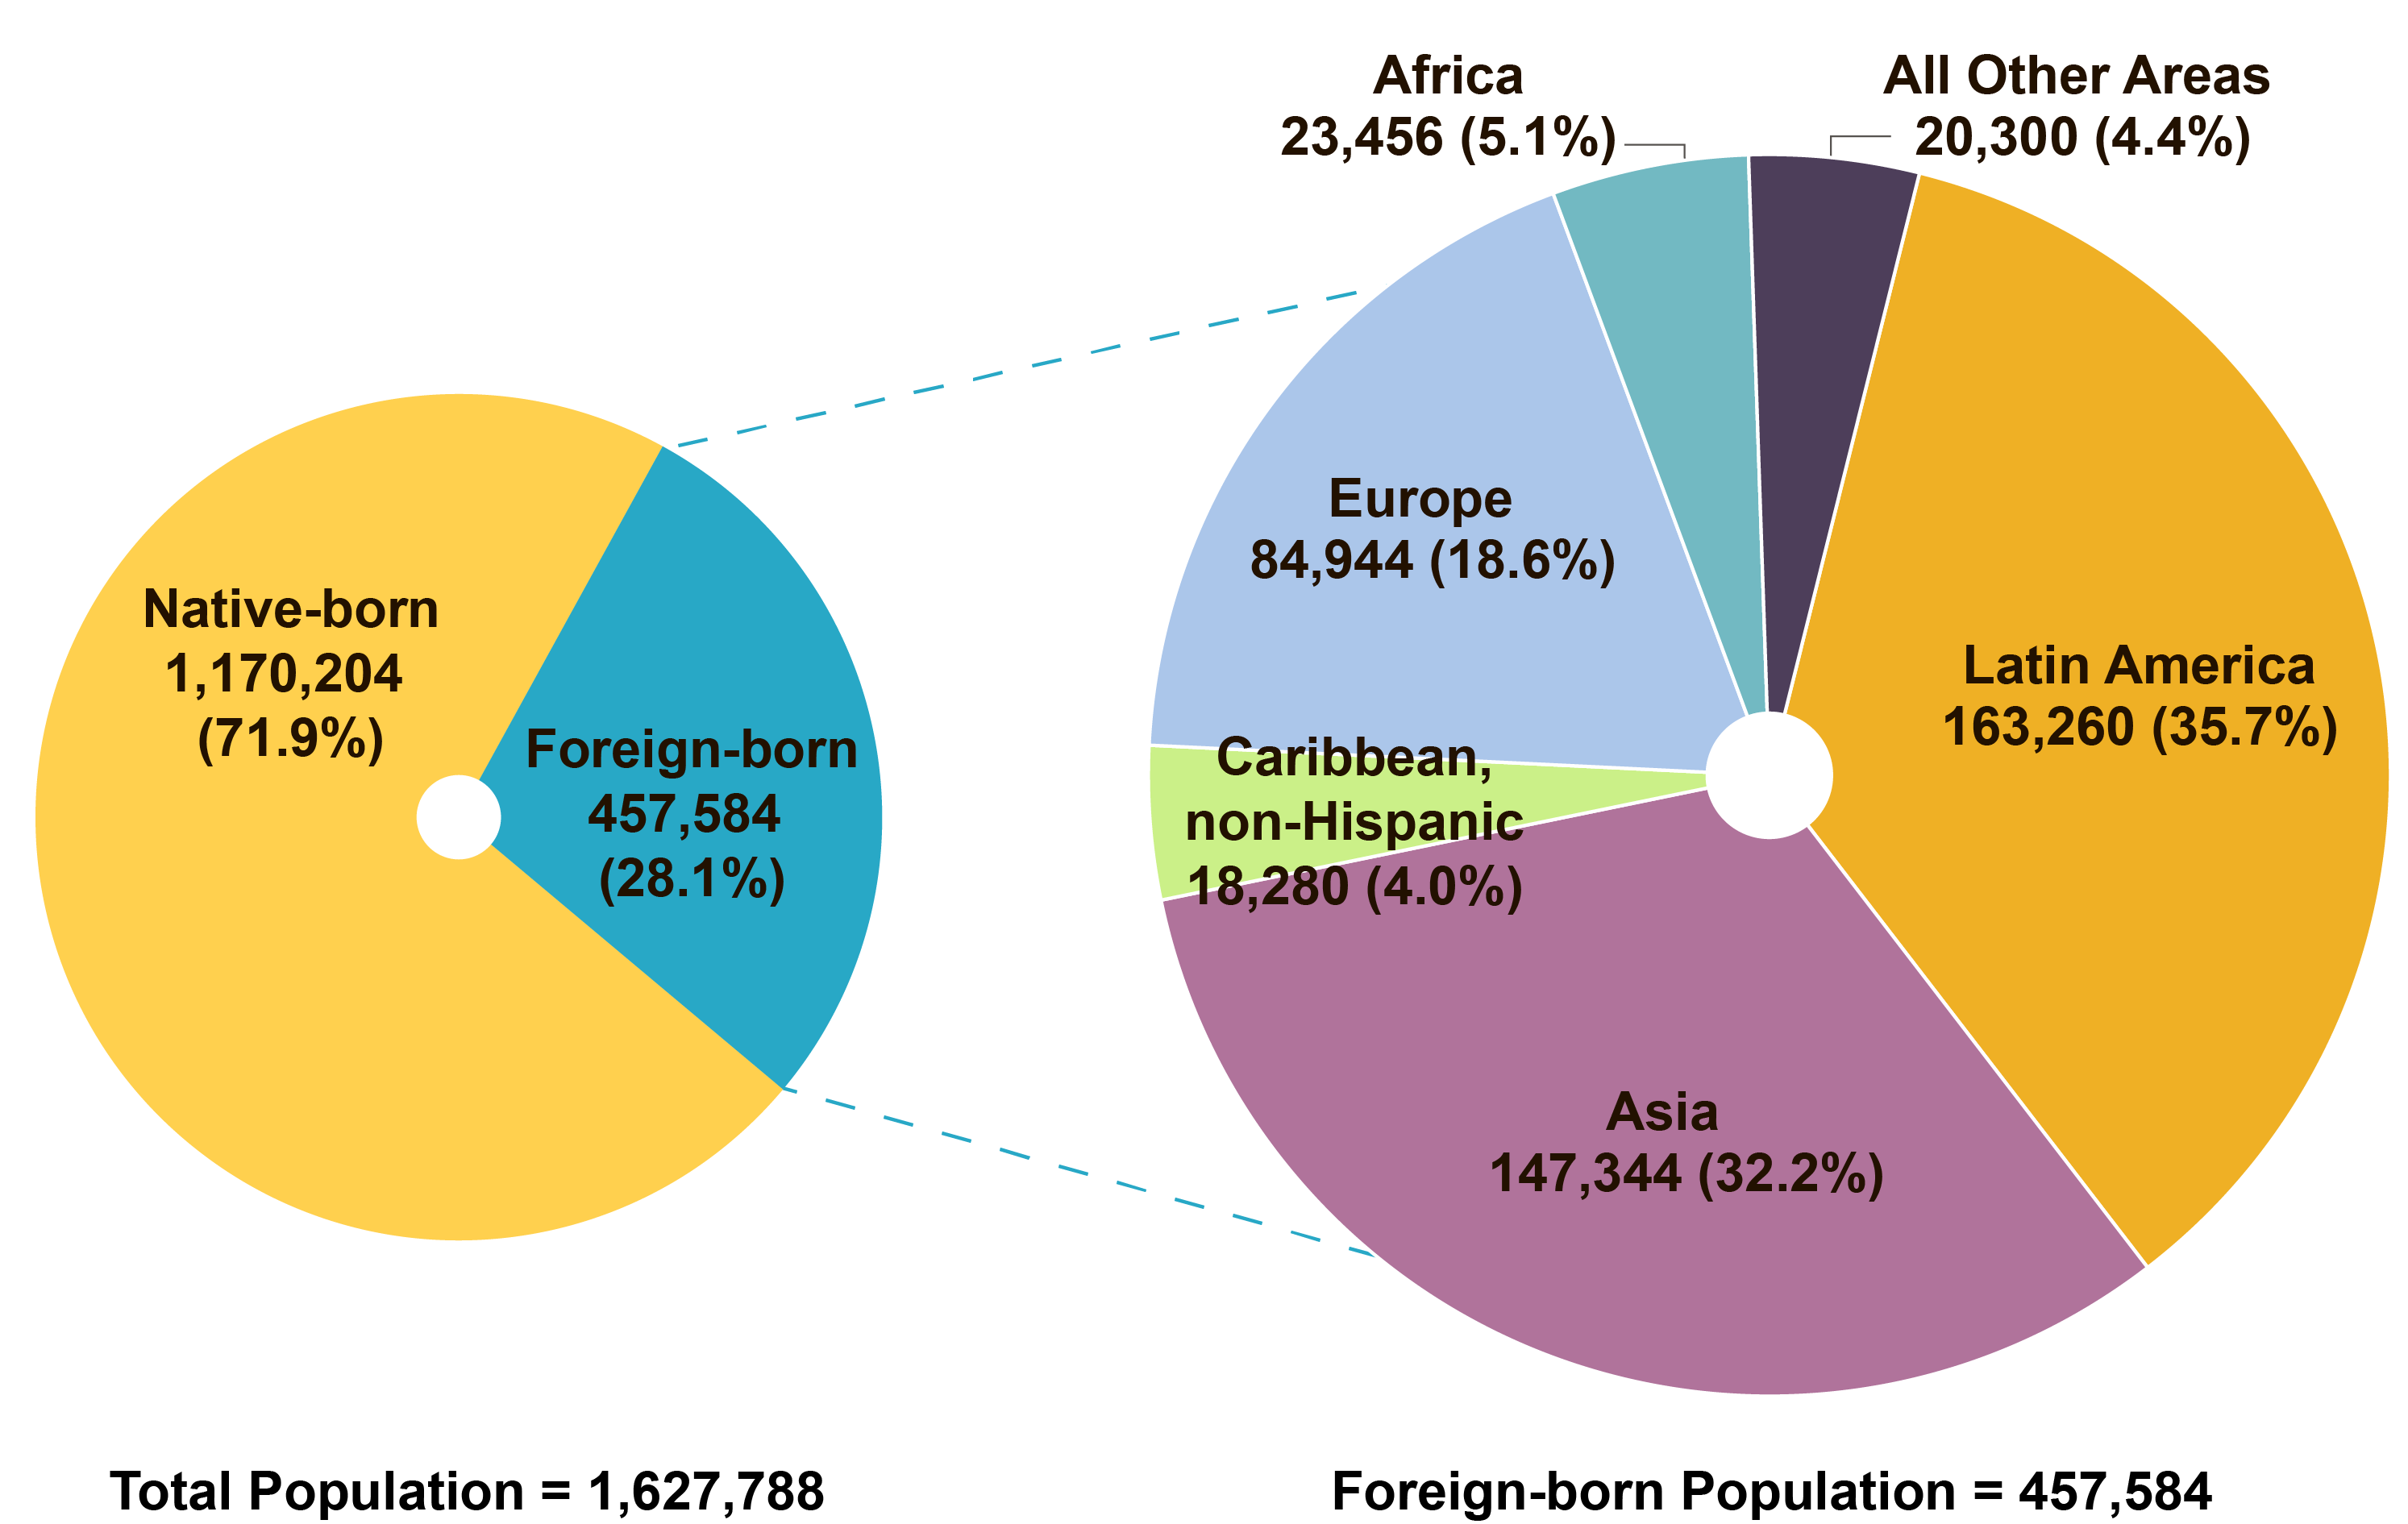
Manhattan had 457,600 foreign-born residents, 28 percent of the borough’s total population (Figure 3.12). Manhattan had a lower proportion of immigrant residents compared to the citywide average, ranking above only Staten Island among the five boroughs. As noted earlier, Manhattan’s immigrant population size has been relatively stable over the past decade.
Latin America and Asia were the two largest areas of origin for immigrants in Manhattan, together accounting for around two-thirds of the foreign-born (Figure 3.12). Europeans comprised nearly 19 percent, while those hailing from Africa (5 percent) and the non-Hispanic Caribbean (4 percent) had shares in the single digits. The share of immigrants from the non-Hispanic Caribbean in Manhattan was much lower than their citywide share (17 percent).
The Dominican Republic and China were, by far, the top countries of origin in Manhattan (Table 3.11). Those born in the Dominican Republic numbered 97,400, representing more than 1-in-5 immigrants in Manhattan. Chinese immigrants numbered 66,300 or 14 percent of the borough’s foreign-born. These two source countries together comprised over one-third of Manhattan’s immigrants, while the remainder were from an array of countries, each with under a 5 percent share of the total.
Manhattan Subsections and Neighborhoods
Manhattan was divided into five subsections—Lower Manhattan, Midtown Manhattan, the Upper East Side, the Upper West Side, and Upper Manhattan—with the corresponding areas of origin and top countries of birth shown in Figure 3.13. The accompanying Table 3.12 shows the total and foreign-born populations in each borough subsection, as well as the distribution of the foreign-born population by area of origin.
Upper Manhattan had the largest number of immigrants (182,800) among the borough’s subsections—exceeding the combined total of Lower Manhattan (86,500) and Midtown (83,700). Upper Manhattan also had a high proportion of foreign-born residents (33 percent), although this was still lower than the citywide average. The Upper East and West Sides each had over 50,000 foreign-born residents, with less than one-quarter of their populations being foreign-born.
Latin American immigrants comprised a significant majority (63 percent) of the foreign-born population in Upper Manhattan, setting it apart from other parts of the borough where Asian and European immigrants predominated. In Lower Manhattan, Asians constituted a majority (55 percent) of the immigrant population, while European immigrants typically made up between 20 and 30 percent of the foreign-born in subsections outside of Upper Manhattan. Immigrants from Africa, the non-Hispanic Caribbean, and other areas had a smaller presence throughout Manhattan, not exceeding 10 percent of the foreign-born population.
Note: Borough subsection values do not sum to borough totals because Marble Hill is located in the borough of Manhattan but is part of the Western Bronx subsection for this analysis. See Box 3.3 for more details.
Marble Hill, with total and foreign-born populations of 10,529 and 3,314, respectively, is located in the borough of Manhattan but is part of Bronx Community District 8 and the Kingsbridge-Marble Hill neighborhood in the Western Bronx. Thus, when Manhattan subsections are summed, the total is lower than the actual Manhattan borough total. The neighborhood and subsection shares of Manhattan’s total and foreign-born populations are calculated using these lower totals of 1,617,259 and 454,270, respectively.
For a neighborhood-level analysis within each borough subsection, Figure 3.14 maps the foreign-born by neighborhood, Table 3.13 presents the total and immigrant population of each neighborhood, while Table 3.14 highlights the top countries of origin for selected neighborhoods.
Washington Heights in Upper Manhattan had 66,300 immigrants, and nearby East Harlem and Harlem also had substantial numbers of immigrants. The densely populated Upper East and Upper West Sides were each home to more than 50,000 foreign-born residents, as mentioned earlier, in part due to the larger geographic size of these neighborhoods (each of which is also a borough subsection). By contrast, the smaller Chinatown-Two Bridges area in Lower Manhattan had 18,700 immigrant residents, who made up a striking 48 percent of its total population. On the Upper West Side, by comparison, the number of foreign-born residents exceeded the entire population of many neighborhoods, yet immigrants accounted for only 23 percent of its residents. Washington Heights stands out for both the size of its immigrant population and its high foreign-born share, with immigrants comprising 44 percent of the neighborhood’s total population.
Neighborhoods are next examined in greater detail within each borough subsection.
Lower Manhattan
Lower Manhattan has long served as a key gateway for immigrants arriving in New York City, and to the United States more broadly. In recent years, it has been home to 86,500 foreign-born residents, who comprised just 28 percent of the area’s population—lower than both the citywide average and the proportions seen in other Manhattan subsections. Within Lower Manhattan, Chinatown-Two Bridges stood out as the leading immigrant hub, with nearly one-half of its population being foreign-born. China was by far the largest country of origin in this neighborhood, accounting for 14,600 residents—or nearly 80 percent of the foreign-born population. Small numbers from other Asian countries were also present. Dominican immigrants resided in many Lower Manhattan neighborhoods; they made up nearly 18 percent of the foreign-born population on the Lower East Side. A diverse array of smaller immigrant populations could also be found throughout Lower Manhattan, including those born in the United Kingdom, Canada, and India.
Midtown Manhattan
Midtown is one of the wealthiest subsections of the city. It was home to 83,700 immigrants hailing from a wide range of countries. Chinese immigrants were the top group in many Midtown neighborhoods, and made up a notable 14 percent of Midtown’s immigrant population, or about 11,600 residents, though Chinese immigrants comprised a smaller share of the foreign-born population in Midtown compared to Lower Manhattan. Hell’s Kitchen was home to a large foreign-born population in the Midtown area, with 17,300 immigrants, including immigrants from China, the Dominican Republic, and India. Midtown-Times Square had the highest proportion of foreign-born residents (37 percent), with immigrants from China, India, and the Philippines.
Upper East Side
The Upper East Side, another one of the city’s more affluent areas, was home to 50,900 foreign-born residents representing a wide range of origins. Unlike many other parts of the city where one or two immigrant groups often predominate, the Upper East Side’s immigrant population was highly diverse, with the two top immigrant groups, from China and India, comprising just 9 percent and 7 percent of the foreign-born population, respectively. Other groups included immigrants from France, Japan, and the United Kingdom. The top five countries of origin combined made up less than 30 percent of the foreign-born total.
Upper West Side
The Upper West Side, like the Upper East Side, was characterized by a relatively affluent population and a diverse mix of immigrants, with no single predominant group. Chinese immigrants were the most sizable group, numbering around 5,900 residents, but they represented just 12 percent of the neighborhood’s foreign-born population. Dominicans, with 4,100 residents (8 percent), were concentrated primarily in the northern part of the neighborhood. Other notable groups included those born in the United Kingdom, Mexico, and Korea, contributing to the area’s broad diversity of origins.
Note 1: Only residential neighborhoods are included in this table. Neighborhoods may not sum to borough subsection totals because subsection totals also include small populations present in large parks and other non-residential areas.
Note 2: Borough subsection values do not sum to borough totals because Marble Hill is located in the borough of Manhattan but is part of the Western Bronx subsection for this analysis. See Box 3.3 for more details.
Upper Manhattan
Upper Manhattan stood out from the rest of the borough for its large foreign-born population and significant presence of immigrants from Latin America, particularly those from the Dominican Republic. Of the 182,800 foreign-born residents in Upper Manhattan, 81,600—or 45 percent—were born in the Dominican Republic. While Dominicans were widely represented across Upper Manhattan, they had a pronounced presence at the northern end of the borough, in Washington Heights (41,100) and Inwood (10,900), where they comprised a large majority of the immigrant population.
Washington Heights and Inwood were also among the most prominent immigrant hubs in Manhattan, with foreign-born residents accounting for 44 percent and 41 percent of their total populations, respectively. While Dominicans predominated, these neighborhoods also included sizable populations from other Latin American countries such as Ecuador, Mexico, El Salvador, Cuba, and Peru.
Farther south, Hamilton Heights-Sugar Hill also had an above-average share of immigrants, with foreign-born residents making up 38 percent of the population. Among them, Dominicans (10,600) accounted for just over one-half (52 percent) of the neighborhood’s immigrant population.
In addition to Dominicans, Mexican and Chinese immigrants had substantial populations, both exceeding 10,000 across Upper Manhattan. However, their settlement patterns differed: While nearly one-half of the Chinese foreign-born population was concentrated in East Harlem, Mexican immigrants were more evenly distributed in neighborhoods across Upper Manhattan.
African immigrants made up just 7 percent of the foreign-born population in Upper Manhattan—13,300 individuals in total—and no single African country ranked among the top five immigrant groups in any neighborhood within the area. However, their presence was strongly concentrated in Harlem, which was home to 7,600 African immigrants, or more than one-half of the group’s population in Upper Manhattan. While there was no African country in the top five, African immigrants collectively comprised nearly one-quarter of Harlem’s foreign-born residents, forming a substantial presence in the neighborhood (data not shown).
Queens
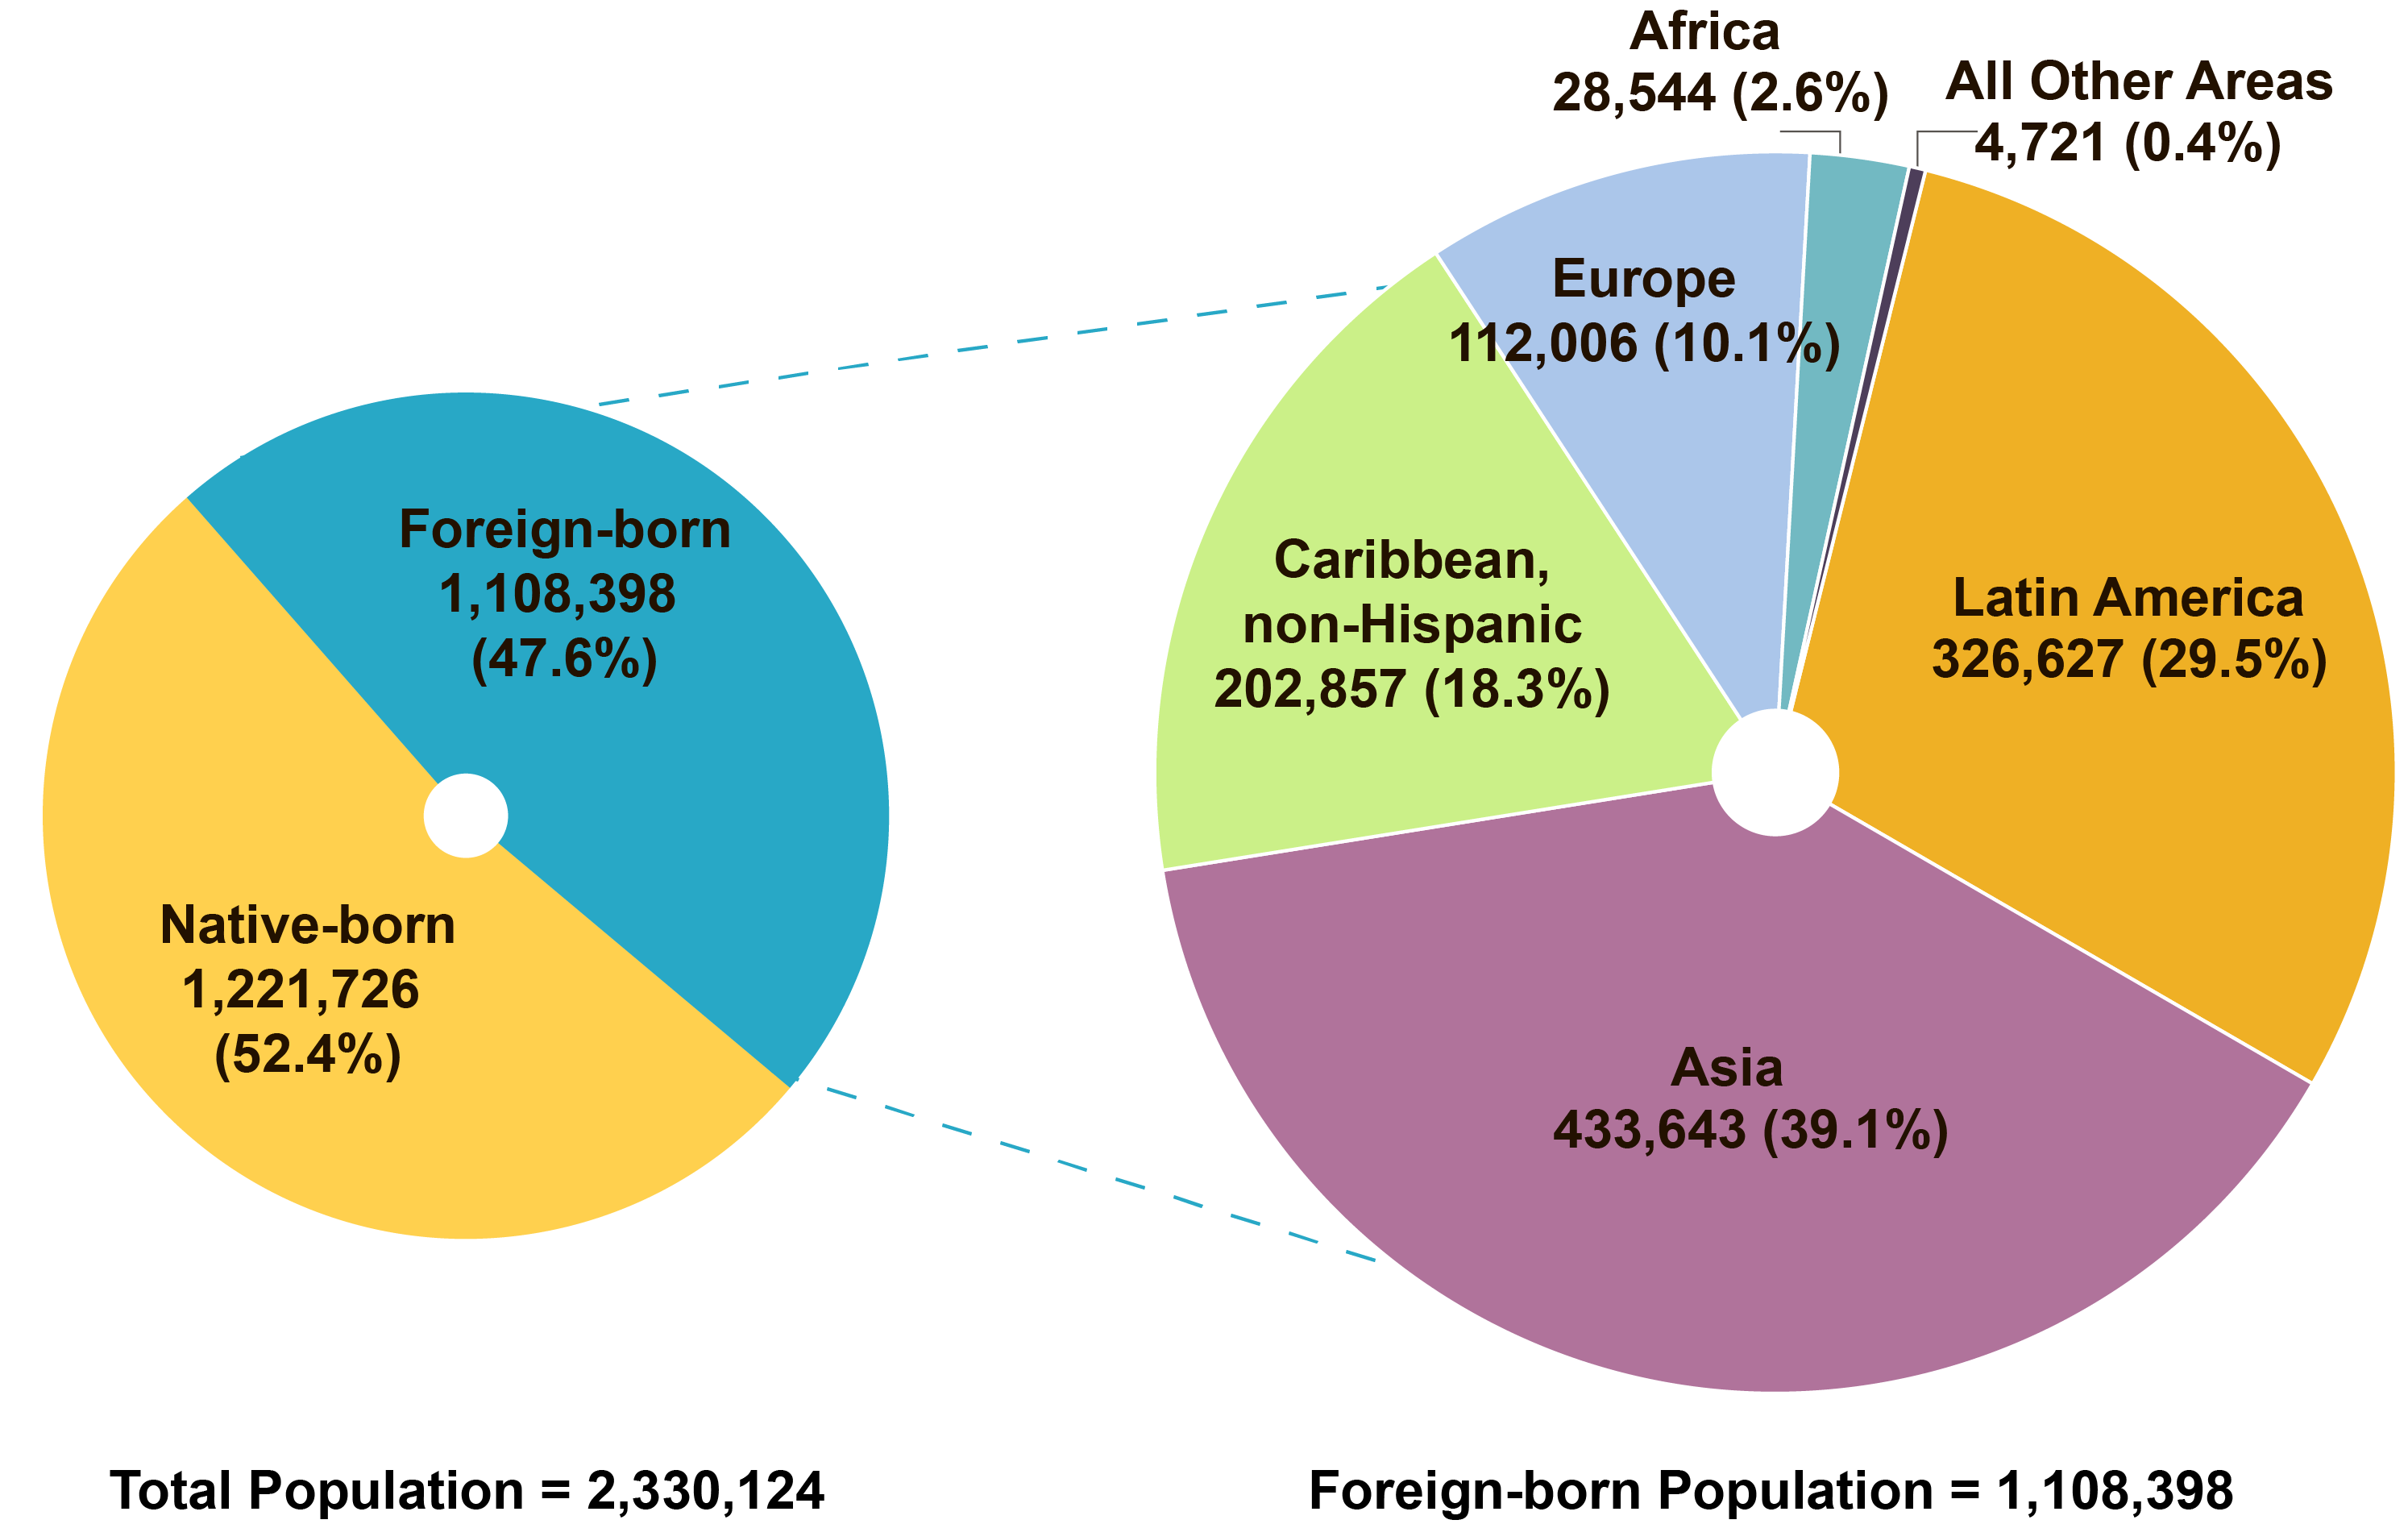
Queens has earned its reputation as “the world’s borough,” boasting the largest immigrant population among New York City’s five boroughs. Around 1.1 million foreign-born residents called Queens home, accounting for close to one-half (48 percent) of the borough’s population (Figure 3.15). This proportion far exceeded the citywide average and was more than 12 percentage points higher than any other borough.
Immigrants from Asia and Latin America accounted for 39 percent and 29 percent of the foreign-born population in Queens, respectively; those from the non-Hispanic Caribbean comprised 18 percent and European immigrants 10 percent. Fewer than 3 percent of foreign-born residents of Queens were born in Africa. Compared to New York City as a whole, Queens had a larger share of Asian immigrants, while the proportions of Latin American and non-Hispanic Caribbean immigrants were roughly in line with citywide averages. By contrast, immigrants from Europe and Africa were underrepresented in Queens relative to their shares across the city.
China stood out as the top country of origin among immigrants in Queens (Table 3.15), with 172,400 residents or 16 percent of the borough’s foreign-born population, followed by immigrants from Guyana, with 84,500 residents—a particularly notable figure given that it represents one-tenth of Guyana’s entire national population. Ecuadorians also had a large presence in Queens, numbering around 76,800. In addition to these groups, five other countries each had immigrant populations in Queens exceeding 50,000—Bangladesh, the Dominican Republic, Jamaica, Mexico, and Colombia—each representing around 5 percent or more of the borough’s foreign-born population. These figures further highlight the remarkable diversity of immigrant communities in Queens.
Queens Subsections and Neighborhoods
Queens was divided into four subsections—Northwestern Queens, Northeastern Queens, Southeastern Queens, and Southwestern Queens—which are shown along with their areas of origin and top source countries in Figure 3.16. Table 3.16 shows the total and foreign-born populations in each borough subsection, as well as the distribution of the foreign-born population by area of origin.
Northwestern Queens had the largest foreign-born population of any borough subsection in New York City, with 457,700 immigrants—about the same as the entire immigrant population of Manhattan. Both Northeastern and Southeastern Queens each had around one-quarter million foreign-born residents, while Southwestern Queens had the smallest immigrant population in the borough, at 139,300. The foreign-born share of the population was consistently high across Queens. In the Northwestern, Northeastern, and Southwestern subsections, immigrants made up approximately one-half of residents. Southeastern Queens had the smallest share at 42 percent, still notably above the citywide average.
The foreign-born population of Northwestern Queens was primarily composed of immigrants from Latin America and Asia, who accounted for 44 percent and 35 percent, respectively. Europeans made up a smaller share at 15 percent, while immigrants from the non-Hispanic Caribbean and Africa had a very small presence. By contrast, in Northeastern Queens—east of Flushing Meadows-Corona Park—Asians were the predominant group, with a 68 percent share of the foreign-born population. Latin Americans were the only other group with a double-digit share, representing 16 percent of the foreign-born population.
Across the Grand Central Parkway in Southeastern Queens, non-Hispanic Caribbean immigrants made up the majority of the foreign-born population at 52 percent. Asians and Latin Americans accounted for 22 percent and 17 percent, respectively. Southwestern Queens had the most evenly distributed immigrant population by area of origin. Non-Hispanic Caribbean immigrants comprised a plurality, with 35 percent: Latin Americans and Asians accounted for 30 percent and 27 percent, respectively. Immigrants from Europe and Africa had shares in the single digits.
For a neighborhood-level analysis within each borough subsection, Figure 3.17 maps the immigrant population by neighborhood, Table 3.17 presents the total and foreign-born population of each neighborhood, and Table 3.18 highlights the top source countries for selected neighborhoods.
In a city full of major immigrant hubs, a number of neighborhoods stood out in Queens. Flushing-Murray Hill had a foreign-born population numbering 95,700 residents, who made up two-thirds (67 percent) of its total population, while Elmhurst and Corona, were home to 66,500 and 64,800 foreign-born residents, respectively. Elmhurst’s foreign-born population also comprised about two-thirds (66 percent) of its total population, while immigrants made up a substantial majority (61 percent) of Corona’s population. Jackson Heights and Astoria also had sizable immigrant populations, each exceeding 50,000. In contrast to Jackson Heights, where immigrants comprised nearly 60 percent of the population, Astoria’s foreign-born share was significantly lower at just 36 percent. South Ozone Park, located in Southwestern Queens, also stood out with an immigrant population of 46,100—constituting 57 percent of the total population. Other neighborhoods in Queens with a large immigrant presence included Forest Hills (41,200), Jamaica (33,600), and Richmond Hill (32,500). Even beyond these major immigrant hubs, foreign-born residents were well represented throughout the borough; most Queens neighborhoods had a foreign-born population share above the city average and nearly one-third of its neighborhoods had an immigrant majority.
Neighborhoods are next examined in greater detail within each borough subsection.
Northwestern Queens
Northwestern Queens is home to a large immigrant population, concentrated along a string of major immigrant hubs that follow the number 7 subway line, as previously noted. Beyond this corridor, neighborhoods such as Astoria, Forest Hills, and Ridgewood also have substantial foreign-born populations.
Several Latin American groups were prominent in Northwestern Queens. Ecuadorians comprised around 13 percent of the foreign-born, with 57,300 residents, and there was a substantial presence of Mexicans (42,900), Colombians (31,500), and Dominicans (29,000). These countries, which ranked among the top five immigrant groups in Northwestern Queens, all had a prominent presence in neighborhoods along the 7-train subway corridor, including Sunnyside, Woodside, Jackson Heights, East Elmhurst, and Corona. The Ecuadorian population was particularly concentrated in Corona, with 17,700 immigrants making up over one-quarter of the neighborhood’s foreign-born residents, joined by 12,200 Mexicans and 10,300 Dominicans. Ecuadorians were also the top immigrant group in East Elmhurst, Sunnyside, and Ridgewood. In Jackson Heights, the immigrant population was notably diverse, with a relatively even mix of Colombians, Ecuadorians, and Mexicans, who together made up about 43 percent of the neighborhood’s foreign-born residents.
Asian immigrant groups also had a strong presence in Northwestern Queens, most notably those born in China, with 49,100 residents, accounting for nearly 11 percent of the total immigrant population. They were the top immigrant group in Elmhurst, numbering 11,100 and making up 17 percent of the neighborhood’s foreign-born population. Chinese immigrants were also the leading group in Forest Hills and Rego Park, where they represented about one-fifth of the foreign-born in each neighborhood. Smaller but notable Chinese communities were also in Astoria, Corona, Jackson Heights, Sunnyside, and Woodside.
Other prominent Asian groups in Northwestern Queens included Bangladeshis and Filipinos. Bangladeshis had a presence in both Sunnyside and Woodside, comprising more than 10 percent of the foreign-born population in each neighborhood. Elmhurst was home to 5,500 Bangladeshi immigrants, while Jackson Heights had 3,500. Despite the smaller number in Jackson Heights, the Bangladeshi community maintained a strong cultural and commercial presence, especially around Diversity Plaza near the Roosevelt Avenue-74th Street subway station, where many Bangladeshi-owned businesses are located. The Filipino population was more concentrated in Woodside and Elmhurst. In Woodside, Filipinos accounted for about 10 percent of the foreign-born population, while in Elmhurst, the community numbered 5,400—making up 8 percent of the neighborhood’s immigrant residents.
Astoria, while home to a large native-born population, had a highly diverse mix of immigrant groups. Greek immigrants numbered 4,400, and no single country of birth accounted for more than 10 percent of the foreign-born population. Forest Hills and Rego Park also stood out for their distinct immigrant profiles, with substantial populations from Uzbekistan, India, and Russia—alongside Chinese and Colombian immigrants, who were more widely represented across the borough subsection. Ridgewood, in addition to its significant Ecuadorian, Dominican, and Mexican communities, had a notable presence of Polish- and Albanian-born residents, groups that are relatively uncommon elsewhere in Northwestern Queens.
Northeastern Queens
Northeastern Queens was home to over one-quarter million foreign-born residents, with East Asian immigrants—particularly Chinese and Korean—comprising the largest shares. The Chinese population numbered around 110,000 or more than 40 percent of immigrants in this borough subsection, while 24,900 Korean immigrants also called the area home.
Much of the immigrant population was centered in Flushing-Murray Hill, the neighborhood with the largest immigrant population in New York City. This one neighborhood alone was home to 55,900 Chinese-born residents—roughly one-half of all Chinese immigrants in Northeastern Queens—and 9,900 Koreans. Chinese and Korean immigrants also made up the majority of the foreign-born population in nearby Auburndale and Fresh Meadows. Chinese immigrants were also the top group in Queensboro Hill, comprising two-thirds of the foreign-born population, and in College Point, where they made up one-third.
While East Asian immigrants predominated in this subsection, Latin American communities also had a substantial presence—though their numbers were smaller and they made up a smaller share of the foreign-born population across these neighborhoods. Colombians had a presence in Flushing-Murray Hill and Dominicans in College Point. Bangladeshi immigrants were the leading group in several neighborhoods to the south, including Jamaica Hills-Briarwood and Jamaica Estates-Holliswood, where they accounted for roughly one-fifth of the foreign-born population.
Note: Only residential neighborhoods are included in this table. Neighborhoods may not sum to borough subsection totals because subsection totals also include small populations present in large parks and other non-residential areas.
Southeastern Queens
Non-Hispanic Caribbean groups made up the largest share of the nearly one-quarter million foreign-born residents in Southeastern Queens. Jamaica was the top country of origin, with 46,500 immigrants comprising 19 percent of the foreign-born. Other prominent Caribbean-origin groups included Guyanese (38,600), Haitian (19,400), and Trinidadian (13,300) immigrants. In addition to these Caribbean populations, the borough subsection was also home to a significant Bangladeshi population, with 21,300 immigrants—accounting for 9 percent of the foreign-born. Springfield Gardens and St. Albans were especially strong centers of the Jamaican immigrant population. Jamaicans comprised 41 percent of the foreign-born population in Springfield Gardens and 37 percent in St. Albans. These areas also had notable populations of Haitian-, Guyanese-, and Trinidadian-born New Yorkers, reinforcing the Caribbean character of this subsection of Queens.
In Queens Village, the 5,900 Guyanese immigrants accounted for more than one-fifth of the neighborhood’s immigrant population. They were joined by Haitians, Jamaicans, Bangladeshis, and Filipinos. Across Jamaica Bay, at the base of the Rockaway Peninsula, Far Rockaway also hosted a significant Caribbean-born population, particularly from Jamaica and Guyana. The area’s immigrant population also included communities from El Salvador, the Dominican Republic, and Guatemala, reflecting a blend of Caribbean and Latin American groups. The largest immigrant hub in this subsection was Jamaica, aided by its transportation links, including access to JFK International Airport via the AirTrain. It emerged as a major neighborhood of settlement for the Bangladeshi community, with 9,700 Bangladeshi immigrants making up 29 percent of the foreign-born population. The neighborhood was also home to Guyanese and Guatemalan immigrants.
Southwestern Queens
Although Southwestern Queens is the smallest borough subsection in geographic size, it had a high immigrant density, with its 139,300 foreign-born residents constituting nearly one-half of the area’s total population. Guyanese immigrants were the most prominent group, comprising 27 percent of the foreign-born population, or about 37,000 residents. No other group made up as much as 10 percent, but several communities had sizable populations, including Dominicans (11,600), Indians (10,200), Bangladeshis (9,400), and Trinidadians (8,900). South Ozone Park stood out as the main center of the Guyanese community in the area, with 22,800 Guyanese-born residents making up nearly one-half of the neighborhood’s immigrant population. Trinidadians and Indians together accounted for an additional 20 percent of foreign-born residents. Liberty Avenue, which runs along the northern edge of South Ozone Park near Richmond Hill, served as a key cultural and commercial corridor for these communities. Different stretches on or near the avenue have earned monikers such as Little Guyana, Little Punjab (around 101st Street), and Trinidad and Tobago Street (part of 131st Street), reflecting the strong immigrant presence and cultural identity.
Just north of Liberty Avenue, Richmond Hill was also home to many Guyanese (8,700) and Indian immigrants. Though smaller in number, Latin American immigrants from Ecuador and the Dominican Republic were also present in Richmond Hill, as well as in South Ozone Park.
Farther west, near the Brooklyn border, Woodhaven hosted a more varied immigrant population that included communities from Latin America, Asia, and the non-Hispanic Caribbean. With 4,200 and 3,500 immigrants, respectively, Dominicans and Chinese were the major groups in Woodhaven, together accounting for one-third of the foreign-born population. Immigrants from Ecuador, Colombia, and Guyana rounded out the top five countries of origin in the neighborhood.
Staten Island
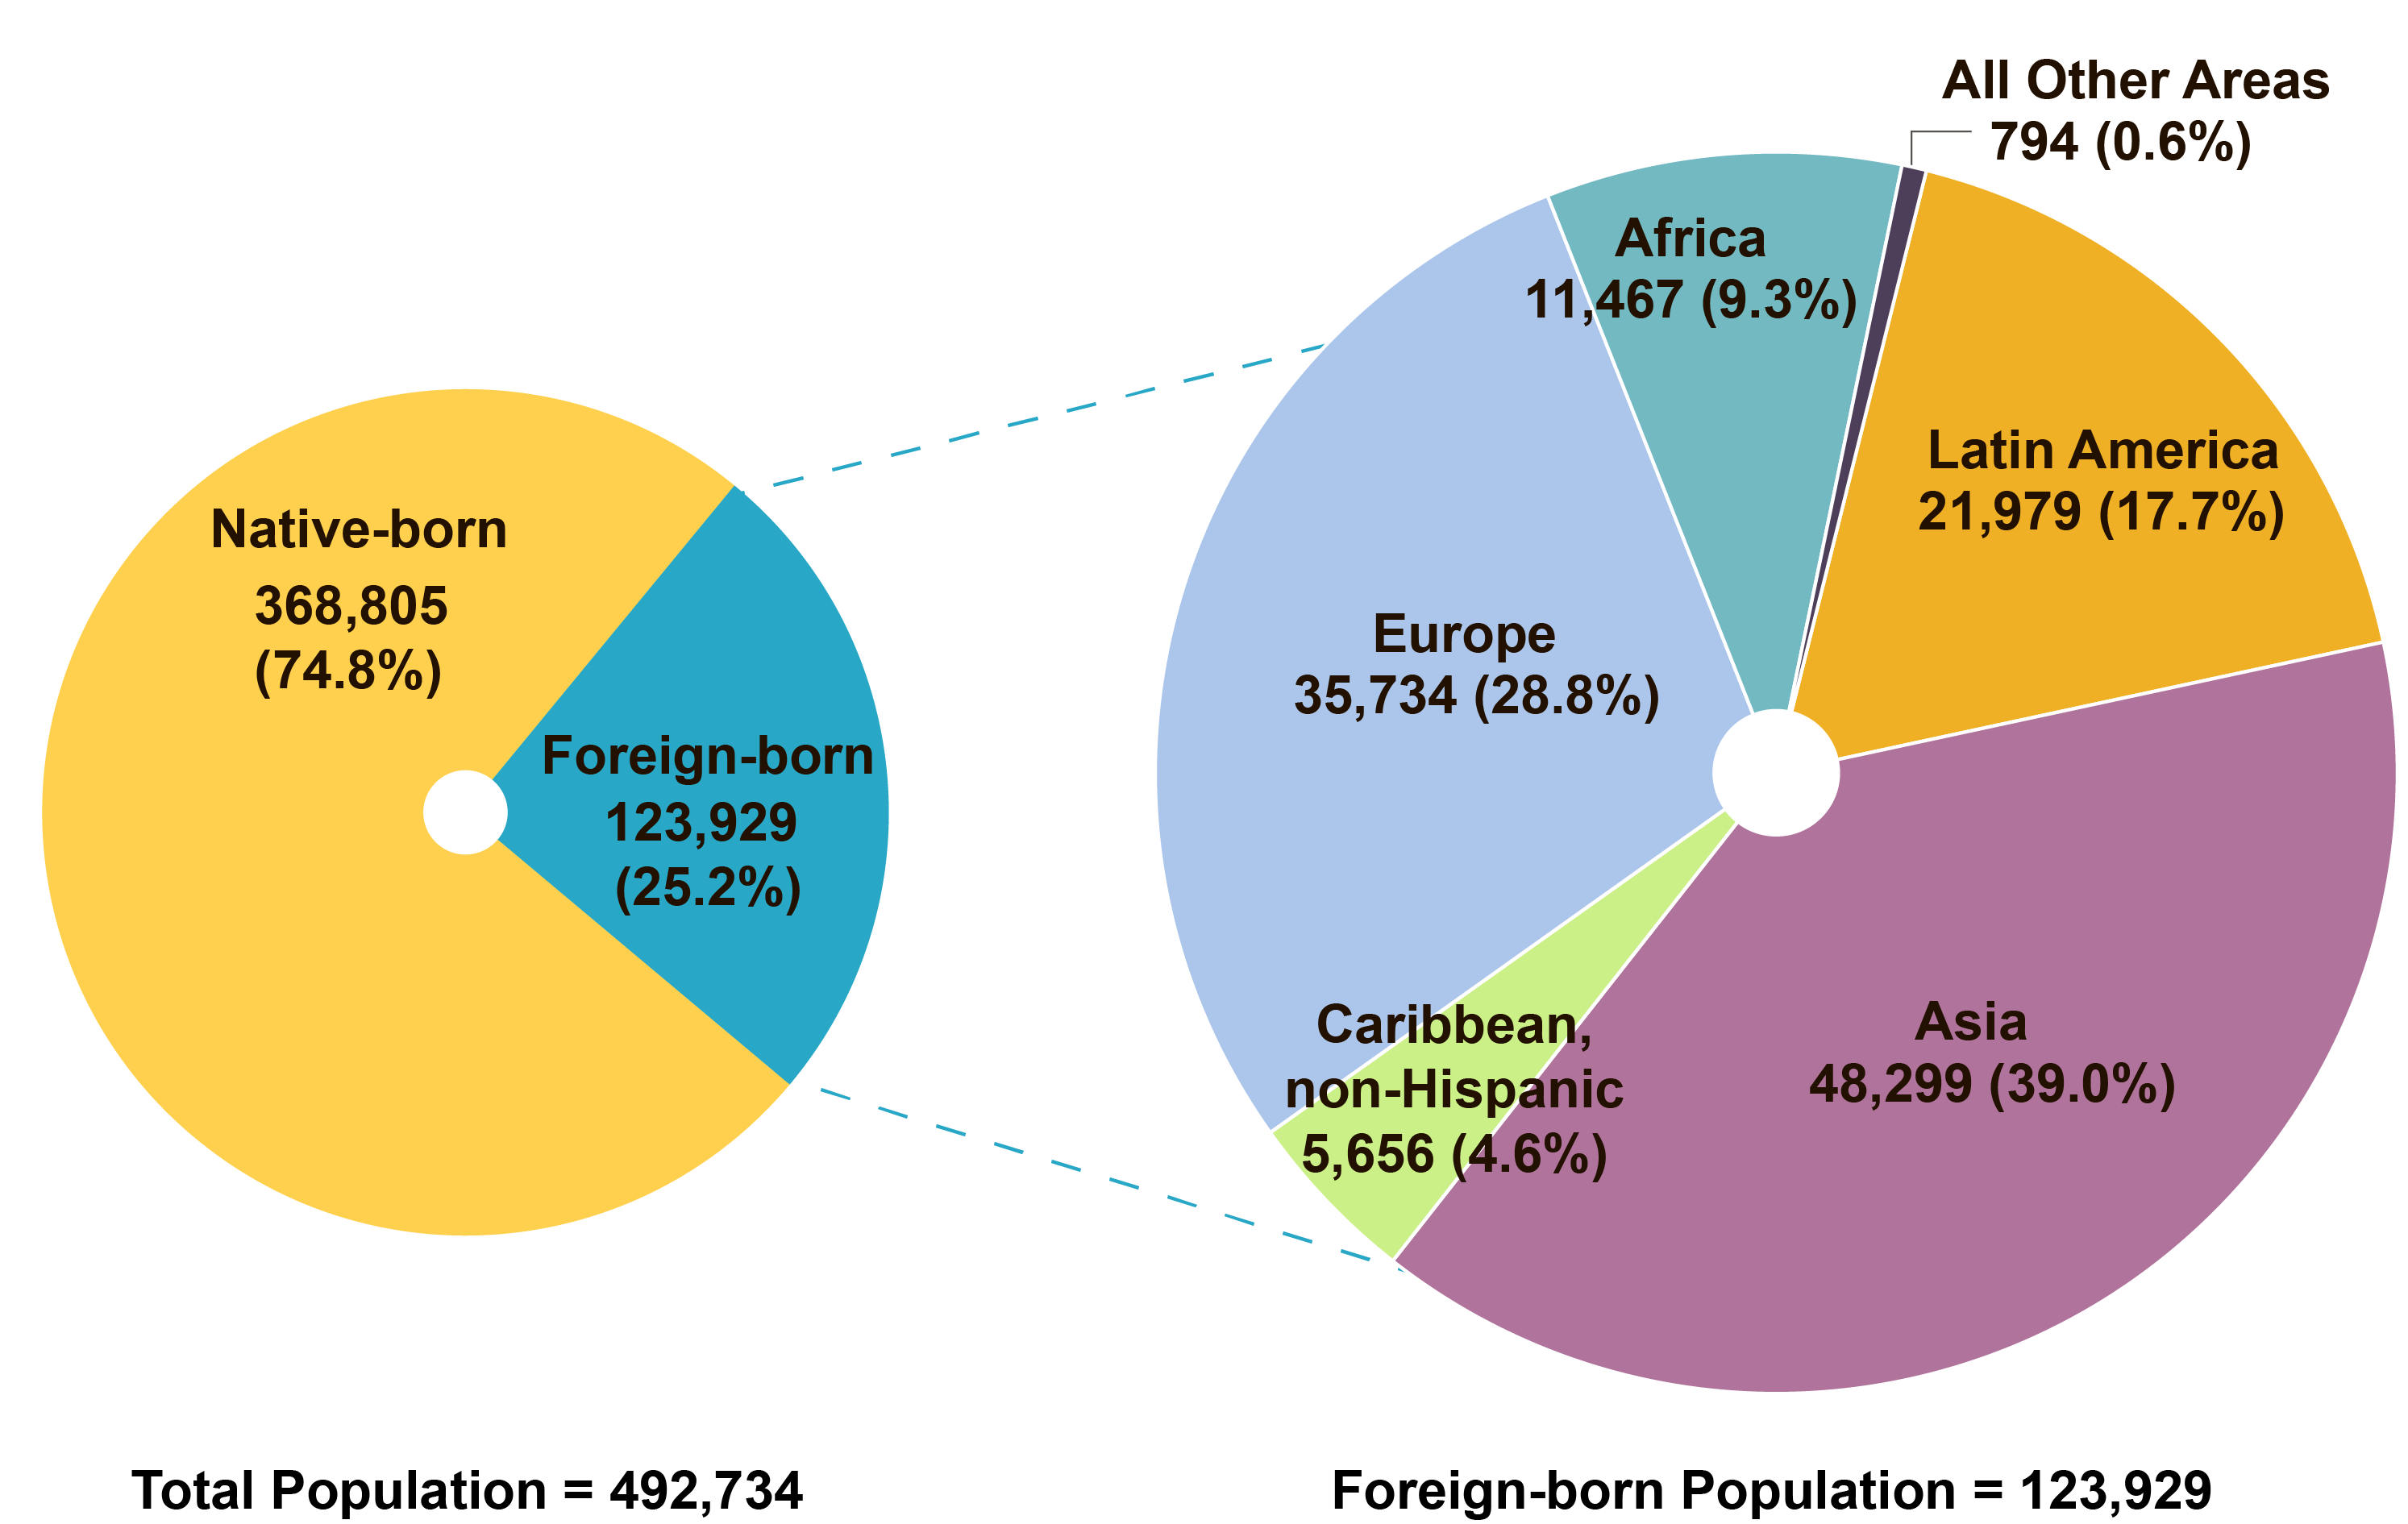
About one-quarter of Staten Island’s residents were foreign-born (Figure 3.18), totaling 123,900 immigrants. Though Staten Island had the smallest immigrant population among the boroughs, it experienced significant growth over the prior decade.
Asian immigrants comprised 39 percent of Staten Island’s foreign-born population, while those born in Europe and Latin America accounted for 29 percent and 18 percent, respectively; the shares for immigrants from Africa (9 percent) and the non-Hispanic Caribbean (5 percent) were in the single digits. Proportionally, immigrants from Asia, Europe, and Africa made up a larger share of Staten Island’s foreign-born population compared to the city overall (Chapter 2, Figure 2.4), while those from Latin America and the non-Hispanic Caribbean represented a significantly smaller percentage than they did citywide.
Table 3.19 examines the top countries of birth of Staten Island’s foreign-born population. China was the largest country of origin with 21,200 residents, or 17 percent of the total, and there was substantial representation for immigrants from Mexico (8,400), Ukraine (6,800), Russia (5,800), and Italy (5,400). The current size of Staten Island’s immigrant Italian population is a fraction of what it once was when they were by far the largest foreign-born group; most Italians on the island are now second generation or beyond. Immigrants from a broad range of other countries had a smaller presence on Staten Island, including those from Egypt, India, Albania, the Dominican Republic, and Poland.
Staten Island Subsections and Neighborhoods
Staten Island was divided into three subsections—the North Shore, Central Staten Island, and Southern Staten Island—which are shown along with the areas of origin of the immigrant population in each subsection (Figure 3.19). This is complemented by Table 3.20, which presents both the total and foreign-born populations in each subsection, as well as the distribution of the foreign-born population by area of origin.
The North Shore and Central Staten Island each had similarly sized foreign-born populations numbering 48,100 and 44,500, respectively. However, immigrants were a higher share of the total population in Central Staten Island, where they accounted for 31 percent versus just over one-quarter on the North Shore. Southern Staten Island had the fewest immigrants and the smallest share of foreign-born residents of any borough subsection in the city—immigrants numbered 31,400 and comprised under 1-in-5 residents.
On the North Shore, immigrants from Asia and Latin America represented the largest groups, each comprising just under one-third of the foreign-born population. The North Shore also had greater diversity of countries of origin compared to other subsections, with substantial representation from other areas of the world. Indeed, south of the Staten Island Expressway in Central Staten Island, the presence of Latin American immigrants was smaller, while the concentration of Asian immigrants was larger at one-half of the foreign-born population; European immigrants accounted for an additional 30 percent. In Southern Staten Island, the composition was also distinct, with European immigrants comprising nearly one-half and Asian immigrants accounting for one-third.
Neighborhoods within each borough subsection are next examined in detail. Figure 3.20 maps the foreign-born population by neighborhood, Table 3.21 shows the total and immigrant population of each neighborhood, while Table 3.22 examines the top countries of origin for selected neighborhoods.
To meet minimum population thresholds, neighborhoods created for this study were usually aggregations of a small number of residential areas (see Box 3.1 for more details); however, on Staten Island it was necessary to combine a greater number to meet the thresholds. While overall population thresholds were met, there were still fewer than 10,000 foreign-born residents in most Staten Island neighborhoods.
Grasmere-Arrochar-South Beach-Dongan Hills stood out for having both the largest number of immigrants on the island (13,200) and a relatively large share of immigrants (36 percent), closely aligning with the citywide average. The adjacent, smaller, neighborhood of Rosebank-Shore Acres-Park Hill also had a large share of immigrants (37 percent). Both neighborhoods are common destinations for immigrants relocating from Brooklyn. Immigrants were less than one-third of the population in every other neighborhood on Staten Island.
In addition to Grasmere-Arrochar-South Beach-Dongan Hills, the neighborhoods of New Springville-Willowbrook-Bulls Head-Travis, located on the western side of the island near Fresh Kills Park, and Great Kills-Eltingville to the south, each had more than 10,000 foreign-born residents.
North Shore Staten Island
The North Shore of Staten Island had a more prominent Latin American immigrant presence than other parts of the borough, at about 29 percent. Asians also comprised a substantial share at about 31 percent. Mexican and Chinese immigrants were the top groups in this subsection.
Mexicans were particularly concentrated in Port Richmond, and farther east on the North Shore, Chinese immigrants were predominant in Rosebank-Shore Acres-Park Hill. This area’s proximity to the Verrazzano-Narrows Bridge facilitates connections to larger Chinese communities in Brooklyn neighborhoods such as Dyker Heights and Sunset Park.
Central Staten Island
Chinese immigrants were by far the largest group in Central Staten Island, with a population of 10,700, accounting for about one-quarter of this subsection’s foreign-born population. Other groups with a presence included immigrants from Ukraine, India, Russia, and Mexico.
In Grasmere-Arrochar-South Beach-Dongan Hills, another neighborhood with quick access to the Verrazzano-Narrows Bridge, Chinese immigrants were the predominant group and there was also a presence of Ukrainian- and Russian-born New Yorkers. In New Springville-Willowbrook-Bulls Head-Travis, China again was the top country of origin, but the neighborhood was also home to immigrants from a diverse mix of countries, including Korea, Egypt, Israel, and Mexico.
*Note: Only residential neighborhoods are included in this table. Neighborhoods may not sum to borough subsection totals because subsection totals also include small populations present in large parks and other non-residential areas.
Southern Staten Island
Southern Staten Island had fewer immigrants than any other borough subsection in the city, both in absolute numbers and as a share of the population. It was home to a sizable Chinese immigrant population numbering 5,300, comparable to the Chinese immigrant population on the North Shore. This subsection was also home to immigrants from Ukraine, Italy, Russia, and Egypt.
The neighborhood of Great Kills-Eltingville had a relatively large foreign-born population of 11,500, and its mix of countries of origin generally reflected the broader composition of Southern Staten Island.
Patterns of Residence for Major Immigrant Countries of Origin
This section examines the residential patterns of the major immigrant countries of origin of the foreign-born in New York City, followed by a section detailing residential patterns for three regional groupings. Many new immigrants often choose neighborhoods where there is already a strong presence of people from their country of origin, facilitating access to established support networks as well as culturally tailored goods and services, among other factors. These concentrations typically grow through continued inflows based on kinship ties and are further shaped by the U.S.-born children of immigrants, as well as the departure of other groups. This pattern leads to the formation of ethnic enclaves, where an immigrant group makes its social, economic, and cultural imprint on a neighborhood. Over time, ethnic enclaves may expand, shift, or become less concentrated, depending on the level of continued flows from the country of origin, among other factors.
For each of the city’s largest immigrant groups, their borough distribution and settlement patterns by neighborhood are mapped and analyzed for the 2019-2023 period, and neighborhoods with each group’s highest concentrations are tabulated and discussed.
Residential Patterns of Chinese Immigrants
The Chinese foreign-born population (immigrants from the mainland, Hong Kong, and Taiwan) grew over the prior decade, in contrast to many groups that experienced a decline. Consequently, for the first time, Chinese immigrants were ranked as the largest foreign-born group by population, alongside Dominicans (see Box 2.2 in Chapter 2 for details on ranking groups). The city’s 397,200 Chinese-born residents (Table 3.23) accounted for close to 13 percent of the total immigrant population.
Forty-four percent of Chinese immigrants lived in Queens and 30 percent lived in Brooklyn, together accounting for 295,000 Chinese-born residents. Manhattan’s 69,600 Chinese-born residents represented nearly 18 percent of the group’s total, and 7 percent lived on Staten Island. While Staten Island’s Chinese population remained relatively small, it was the only borough with significant growth in Chinese immigrants from 2013 to 2023. Brooklyn’s large Chinese population declined significantly in size over the decade, a notable shift compared to earlier periods when Brooklyn’s Chinese population experienced growth.
New York City’s Chinese population has long been concentrated in three “Chinatowns”: the original Chinatown in Manhattan, Flushing in Queens, and Sunset Park in Brooklyn—particularly the area around 8th Avenue. While these areas have remained major hubs for the Chinese immigrant population (Figure 3.21), the growing community has spread into other areas, most notably Southern Brooklyn, northern parts of Queens, and Staten Island.
Flushing-Murray Hill, one of the city’s three Chinatowns, was the largest immigrant neighborhood overall and, by a wide margin, the largest Chinese enclave. It was home to 55,900 Chinese-born residents, representing 14 percent of all Chinese immigrants in the city (Table 3.24). Sunset Park, Brooklyn’s Chinatown, was home to 27,800 Chinese-born residents. Its large Chinese population was linked via the N and D subway lines to Chinese communities in several nearby Southern Brooklyn neighborhoods, most notably Bensonhurst, which had 21,400 immigrant Chinese residents, as well as Gravesend (17,900) and Dyker Heights (10,000). Chinatown-Two Bridges in Manhattan, the original Chinatown and longtime cultural and commercial hub of the city’s Chinese immigrant community, was home to 14,600 Chinese-born residents. Though it was at one time home to a majority of the city’s Chinese immigrant population, by 2023 it constituted less than 4 percent of the total.
In Queens, large Chinese immigrant populations were concentrated in Elmhurst and Forest Hills in the Northwestern section of the borough, and in Queensboro Hill and Auburndale in Northeastern Queens. There were also sizable Chinese communities in a swath of other neighborhoods across both parts of northern Queens, each with a population of 3,000 or more, with similar concentrations in parts of southern Brooklyn, Lower Manhattan, the Upper East and West Sides of Manhattan, East Harlem, and areas of Staten Island near the Verrazzano-Narrows Bridge. The increase in Staten Island’s Chinese immigrant population—alongside declines in Brooklyn—may reflect a broader shift, with Chinese-born residents moving from established enclaves in Southern Brooklyn across the bridge to Staten Island. This mirrors a similar trajectory taken by Brooklyn’s Italian immigrant community in earlier decades.
Residential Patterns of Dominican Immigrants
Since 1990, Dominicans have been the city’s largest foreign-born group. However, over the past decade, their population declined, while the Chinese immigrant population grew. As a result, by 2023, Dominicans shared the top spot with Chinese New Yorkers as the largest immigrant group in the city (see Box 2.2 in Chapter 2 for details on ranking groups).
The Bronx was home to nearly one-half (48 percent) of Dominican immigrants, while Manhattan’s share was just under one-quarter (Table 3.25). The Dominican population declined in Manhattan, as well as in Queens.
Despite the overall decline in Manhattan’s Dominican immigrant population, Washington Heights in Upper Manhattan remained the largest neighborhood for the Dominican community—with 41,100 Dominican-born residents (Table 3.26). Washington Heights accounted for over 10 percent of the Dominican foreign-born population in the city and was recently designated a Dominican Historic District on the National Register of Historic Places. This recognition reflects its longstanding importance as the central hub of the Dominican immigrant community in New York City and the United States more broadly. Upper Manhattan neighborhoods adjacent to Washington Heights were also major neighborhoods of settlement, with Inwood and Hamilton Heights-Sugar Hill each having close to 11,000 Dominican-born residents.
Across the Harlem River, the Western Bronx had many neighborhoods with large Dominican populations, most prominently University Heights-Morris Heights, which had 28,000 Dominican-born residents, or 7 percent of all Dominican immigrants. Other neighborhoods in the Western Bronx, including Claremont-Mount Eden, Bedford Park, Mount Hope, and Concourse each had 10,000 or more Dominican residents, as did Soundview in the Eastern Bronx. Figure 3.22 shows that outside of Upper Manhattan and the Bronx, a few neighborhoods scattered across the city also had substantial Dominican immigrant concentrations, including Corona and Woodhaven in Queens, as well as East New York, Cypress Hills, Bushwick, Williamsburg, Bedford-Stuyvesant, and Sunset Park in Brooklyn.
Residential Patterns of Jamaican Immigrants
In 2023, New York City was home to 162,500 Jamaican immigrants (Table 3.27), comprising the third largest immigrant group in the city.
Jamaican immigrants were relatively evenly spread among three boroughs: Brooklyn, Queens, and the Bronx. This marked a shift from a decade prior, when Jamaicans were more heavily concentrated in Brooklyn. Over the past 10 years, Brooklyn’s Jamaican population declined, while the populations in other boroughs were relatively stable. If current trends continue, Queens will become home to the largest Jamaican population in the city over the next decade.
East Flatbush, in Central Brooklyn, was the most prominent Jamaican neighborhood, with 16,700 Jamaican-born residents—representing 10 percent of the city’s total Jamaican population (Table 3.28). Indeed, Jamaicans constituted the largest immigrant group in many parts of Central Brooklyn (Figure 3.23), an area widely known as a hub of the non-Hispanic Caribbean diaspora. In addition to East Flatbush, Flatbush and Crown Heights each had over 5,000 Jamaican immigrants. Farther east, Canarsie was another key center of the Jamaican immigrant community, with 10,200 Jamaican-born residents, and an additional 5,600 in nearby East New York.
Beyond Brooklyn, the Northern Bronx and Southeastern Queens were the two primary areas of the city with substantial Jamaican populations. In the Northern Bronx, neighborhoods located near the termini of the number 2 and 5 subway lines had sizable enclaves of Jamaican immigrants, including Eastchester-Edenwald-Baychester (9,900), Williamsbridge (8,100), and Wakefield-Woodlawn (7,200). Many Jamaicans also resided in Co-op City, a large housing development near Pelham Bay.
In Southeastern Queens, Springfield Gardens and St. Albans had large concentrations of Jamaican immigrants, with 9,000 and 8,500 Jamaican-born residents, respectively—each accounting for 5 percent of the city total. The Jamaican-born community was also sizable in other nearby neighborhoods—such as Queens Village, Baisley Park, and Laurelton. Far Rockaway also emerged as an enclave, with 4,100 Jamaican immigrants (data not shown). This expansion of the Jamaican-born population played a significant role in shaping Southeastern Queens more broadly into one of the city’s major centers of immigrant settlement.
Residential Patterns of Mexican Immigrants
Immigrants from Mexico were the third largest foreign-born group in New York City in 2023, alongside Jamaicans (see Box 2.2 in Chapter 2 for details on ranking groups). Mexicans numbered 148,400—or 5 percent of the total foreign-born population. This number was reflective of a decline over the past decade, particularly in Brooklyn, though it remained relatively unchanged in other boroughs.
In the most recent period, Queens had the largest Mexican-born community, with 47,700 residents accounting for 32 percent of the citywide total, while Brooklyn and the Bronx each accounted for close to one-quarter of the city total (Table 3.29).
Northwestern Queens was the most significant area of residence for the Mexican immigrant population in the city, with Corona serving as the main hub and several other neighborhoods along Roosevelt Avenue and the number 7 subway line also home to large Mexican communities (Figure 3.24). The 12,200 Mexican immigrants in Corona made up 8 percent of the citywide total, while nearby Elmhurst and Jackson Heights had 7,100 and 6,900 Mexican-born residents, respectively (Table 3.30). Astoria and Woodside each had approximately 4,000 Mexican-born residents.
In Brooklyn, Sunset Park was the largest enclave for Mexican immigrants, with 10,100 calling it home. The stretch of 5th Avenue running through Sunset Park was a major commercial corridor for the Mexican community. The Mexican population was also spread across many Brooklyn neighborhoods, with Bushwick being home to 3,400 Mexican immigrants. Over the past decade, the Mexican immigrant population in Bushwick decreased—a key factor in the Mexican population’s overall decline in the borough and the broader decline in the neighborhood’s foreign-born population.
In Manhattan and the Bronx, neighborhoods along the Harlem River—such as East Harlem and Mott Haven-Port Morris—each had a substantial number of Mexican residents. In these areas, Mexican immigrants lived alongside larger Dominican and other Latin American communities. Smaller Mexican populations were also found throughout other parts of Upper Manhattan, the Bronx, Southeastern Queens, and Staten Island’s North Shore.
Residential Patterns of Ecuadorian Immigrants
New York City’s Ecuadorian population was the fifth largest immigrant group, numbering 136,800 (Table 3.31). Nearly two-thirds of Ecuadorian immigrants lived in Queens, the only borough with significant growth over the past decade (data not shown). The Bronx and Brooklyn also had notable Ecuadorian populations.
While Queens was home to a large majority of Ecuadorian immigrants in the city, many were concentrated in a few neighborhoods in Northwestern Queens, including the contiguous areas of Corona, Elmhurst, and Jackson Heights (Figure 3.25). Corona was the largest enclave, home to 17,700 Ecuadorian immigrants, while Elmhurst and Jackson Heights each had more than 8,300 (Table 3.32). Together, these three neighborhoods accounted for 27 percent of the city’s Ecuadorian-born population. Straddling the border of Queens and Brooklyn, Ridgewood and Bushwick formed another significant center of the Ecuadorian population, with 6,400 and 3,900 residents respectively.
Washington Heights in Upper Manhattan also had a presence of Ecuadorian immigrants. Smaller numbers of Ecuadorian immigrants co-resided with other Latin American immigrant communities in neighborhoods such as Astoria, East Elmhurst, Cypress Hills, and Sunset Park, as well as other parts of the city.
In contrast to the high concentrations in Queens neighborhoods, the Ecuadorian population in the Bronx—numbering 20,900—was relatively dispersed.
Residential Patterns of Guyanese Immigrants
In 2023, New York City’s 129,000 foreign-born Guyanese made up nearly one-half of the 278,000 Guyanese immigrants in the United States, underscoring the city’s role as a key hub for the Guyanese diaspora in the United States (for broader context, the nation of Guyana has a total population of 831,000 in 2024). Over the past decade, the Guyanese population retained its rank as the fifth largest immigrant group in the city, alongside Ecuadorians (see Box 2.2 in Chapter 2 for details on ranking groups).
As with the Ecuadorian community, a substantial majority (59 percent) of Guyanese immigrants lived in Queens, totaling 76,700 residents in 2023 (Table 3.33). Brooklyn was home to 34,500 immigrants from Guyana, a significant decline from a decade prior (data not shown). By contrast, the smaller Guyanese populations in the Bronx and other boroughs were more stable.
The most significant concentration of the Guyanese population could be seen along a continuous band of neighborhoods stretching from Central and Eastern Brooklyn across to Southeastern Queens (Figure 3.26). South Ozone Park, located near the center of this band, was by far the largest hub of the Guyanese population, with 22,800 Guyanese-born residents comprising 16 percent of the total immigrant Guyanese community (Table 3.33). As mentioned earlier, parts of South Ozone Park, particularly along Liberty Avenue, were commonly referred to as “Little Guyana.” Richmond Hill, just to the north, was home to another 8,700 Guyanese immigrants. A large portion of Guyanese immigrants in these neighborhoods were of Asian descent, and lived alongside a significant population of immigrants from India.
Nearby neighborhoods in the Southeastern and Southwestern sections of Queens also had prominent Guyanese communities, including Baisley Park, Queens Village, Jamaica, St. Albans, South Jamaica, Ozone Park, and Far Rockaway each with between roughly 3,000 and 6,000 Guyanese-born residents.
On the Brooklyn side of this cluster of neighborhoods, East Flatbush had a large Guyanese population numbering 9,400 residents, while East New York and Canarsie were home to 6,800 and 3,200 Guyanese immigrants, respectively. The Guyanese population in these neighborhoods was primarily of African descent, living among other Afro-Caribbean immigrant communities.
The Bronx had a notable Guyanese presence in Williamsbridge and Wakefield-Woodlawn, where Guyanese residents co-resided with a larger Jamaican-born community.
Residential Patterns of Bangladeshi Immigrants
The Bangladeshi population was one of the few groups with significant growth during the prior decade among the city’s top foreign-born populations. With a population of 110,800 (Table 3.35), Bangladeshis were the seventh largest immigrant group in the city.
Most Bangladeshi immigrants lived in Queens (56 percent), totaling 62,600 residents; while Brooklyn and the Bronx were home to 25,200 and 19,100, respectively.
The Bangladeshi immigrant population was concentrated in several neighborhood clusters across Queens, Brooklyn, and the Bronx. The largest of these clusters was in Jamaica and surrounding neighborhoods in Southeastern Queens. Jamaica alone had 9,700 Bangladeshi immigrant residents, with an additional 4,800 in Jamaica Hills-Briarwood, and 3,700 in South Jamaica (Table 3.36). Together, these three neighborhoods accounted for more than 17 percent of the city’s foreign-born Bangladeshis. Bangladeshi immigrants were also concentrated along the Roosevelt Avenue number 7 subway corridor in Northwestern Queens, with Elmhurst, Jackson Heights, and Woodside each having more than 3,000 Bangladeshi residents (Figure 3.27). The area around Diversity Plaza near the Jackson Heights-Roosevelt Avenue/74th Street subway station served as a major commercial and cultural hub for the Bangladeshi immigrant community in this section of Queens.
East New York, along Eastern Brooklyn’s border with Queens, also hosted a growing Bangladeshi population of 6,900 and abutted Ozone Park in Southwestern Queens, which was home to another 5,500. While not among the top neighborhoods, Kensington in Brooklyn was a notable center of the city’s Bangladeshi population, with 3,300 immigrant residents; the corner of Church and McDonald Avenues was formally designated by the city as “Little Bangladesh.”
In the Bronx, Bangladeshi immigrants lived across Parkchester and Castle Hill-Unionport, which together with the adjacent neighborhoods of Westchester Square and Soundview had over 10,000 Bangladeshi-born residents. Norwood, in the northern portion of the Western Bronx, also had a notable Bangladeshi population.
Residential Patterns of Colombian Immigrants
Colombians were among the few major immigrant groups to experience growth, increasing to 86,300 in 2023 (Table 3.37). Colombians were the eighth largest group, alongside Haitians (see Box 2.2 in Chapter 2 for details on ranking groups).
Two-thirds of the city’s Colombian-born residents lived in Queens, which also had a significant increase over the decade. The growth in the Colombian immigrant population was also strong in Brooklyn, which reached 12,000, and constituted 14 percent of Colombian immigrants in the city. Manhattan accounted for an additional 10 percent of Colombians, with 8,900 residents.
Figure 3.28 shows that the Colombian immigrant population was concentrated mainly in Northwestern Queens, with Jackson Heights and Elmhurst being the two largest neighborhoods of settlement, home to 8,700 and 4,900 Colombian-born residents, respectively (Table 3.38). Together, these neighborhoods accounted for 18 percent of the citywide Colombian population and hosted a significant number of Colombian businesses and restaurants along Roosevelt and 37th Avenues. Other neighborhoods that included a notable Colombian immigrant presence included Astoria, Corona, Forest Hills, and Flushing-Murray Hill in Queens, as well as Bushwick in Northern Brooklyn, which was linked through its border with Ridgewood to the larger cluster of Queens neighborhoods with Colombian-born populations.
Residential Patterns of Haitian Immigrants
Haitian immigrants, who along with Colombians were the eighth largest foreign-born group in New York City (see Box 2.2), had a population of 84,100 residents in 2023 (Table 3.39).
The Haitian-born population was concentrated in Brooklyn and Queens, which together comprised 93 percent of the city’s total. Brooklyn accounted for a majority, with 49,700 Haitian immigrants (59 percent), while the 28,400 living in Queens represented over one-third (34 percent).
Most of the city’s major Haitian enclaves were located in a broad cluster of neighborhoods across Central and Eastern Brooklyn, with a smaller cluster present in Southeastern Queens (Figure 3.29).
East Flatbush had the largest Haitian population, with 11,500 residents comprising 14 percent of the citywide total (Table 3.40). Adjacent Flatbush was home to another 7,900 Haitian-born residents—10 percent of the total. In the last decade, the New York City Council designated parts of Flatbush and East Flatbush as the Little Haiti Cultural and Business District and also renamed the Newkirk Avenue subway station Newkirk Avenue-Little Haiti—the only subway station in the city whose name directly references the heritage of its surrounding immigrant community. Parts of the Little Haiti district overlap with areas the city designated as “Little Caribbean,” highlighting how Haitian immigrants co-reside with other non-Hispanic Caribbean immigrants, including Jamaican, Guyanese, and Trinidadian communities.
Not far from East Flatbush, Canarsie and Flatlands in Eastern Brooklyn had large Haitian populations numbering 9,400 and 5,800 residents, respectively. Farther north in Central Brooklyn, there were smaller Haitian populations in Crown Heights and Prospect Lefferts Garden-Wingate. In Southeastern Queens, Queens Village had a Haitian-born population numbering 3,600 residents, with smaller populations in Springfield Gardens, Rosedale, and St. Albans.
Residential Patterns of Immigrants from Trinidad and Tobago
Trinidad and Tobago was the 10th largest country of origin for New York City’s immigrant population (see Box 2.2 in Chapter 2 for details on ranking groups). There were 69,300 Trinidadians living in the city in 2023 (Table 3.41), representing a significant decline since 2013.
Following a similar pattern of residence as the Haitian population, Trinidadians were primarily concentrated in Brooklyn (51 percent) and Queens (33 percent), with smaller communities also present in the Bronx and Manhattan.
In Brooklyn, Trinidadians were mainly concentrated in the Central and Eastern sections of the borough, while in Queens, large populations were found in a cluster of neighborhoods spanning the Southwestern and Southeastern sections of the borough (Figure 3.30).
East Flatbush served as the central hub for the Trinidadian immigrant population, much like it was for many other non-Hispanic Caribbean groups. East Flatbush alone accounted for 14 percent of immigrants from Trinidad and Tobago (Table 3.42) and was the only neighborhood with more than 10,000 Trinidadian residents. Crown Heights was another significant population center, with about 5,000 Trinidadian-born residents, while East New York was home to 3,700. Other Brooklyn neighborhoods with an appreciable presence of immigrants from Trinidad and Tobago included Flatbush, Flatlands, Bedford-Stuyvesant, Canarsie, and Prospect Lefferts Gardens-Wingate.
South Ozone Park was home to 5,800 residents from Trinidad and Tobago and served as Queen’s main hub for this origin group. The city officially designated a stretch of 131st Street where it meets Liberty Avenue as Trinidad and Tobago Street in honor of the community. Baisley Park was another Queens neighborhood with a substantial presence of Trinidadian-born residents.
Patterns of Residence for Selected Immigrant Groupings
While Section 3.7 focused on the borough and neighborhood distribution of the largest immigrant populations by country of birth, this section highlights several emerging immigrant groupings whose areas of origin extend across national boundaries. These groupings—comprising people born in Central America, West Africa, and Arab countries—often share migration patterns and settlement networks.
Residential Patterns of Central American Immigrants
A total of 115,400 immigrants in New York City were born in Central America, a figure roughly comparable to that of Bangladeshi immigrants—the city’s seventh largest group from any single country—and representing 4 percent of all foreign-born residents. For this analysis Central America includes Costa Rica, El Salvador, Guatemala, Honduras, Nicaragua, and Panama, but excludes Mexico and Belize. Of these countries, only El Salvador had an immigrant population large enough on its own to rank among the city’s top 20 immigrant groups.
Central American immigrants mainly settled in Queens (41,900) and Brooklyn (36,200), which together accounted for more than two-thirds of foreign-born Central Americans (Table 3.43).
Central American immigrants were dispersed across a wide range of neighborhoods throughout New York City (Figure 3.31), with the top 10 neighborhoods of settlement accounting for less than 30 percent of their total population. Even so, several notable areas of concentration stood out.
Jamaica in Queens had a large Central American immigrant population, with 4,800 residents (Table 3.44). Far Rockaway had a similarly sized population, numbering 4,700, while 3,700 Central American immigrants lived alongside large Mexican, Dominican, and South American populations in Corona, contributing to the diversity of the Latin American immigrant community in Northwestern Queens.
Bensonhurst, Sunset Park, and Flatbush in Brooklyn were home to large Central American immigrant communities. Many Central American businesses were present along the 5th Avenue corridor of Sunset Park, which also served as an important commercial hub for the Mexican community. In Upper Manhattan, Washington Heights had a Central American population living alongside the predominant Dominican population and others from Latin America.
Residential Patterns of West African Immigrants
The West African immigrant population grew over the past decade to 103,500 in 2023. If ranked alongside individual countries, West Africans would be among the top 10 groups in the city. For this analysis, West Africans were defined as New Yorkers born in Benin, Burkina Faso, Cabo Verde, Cote D’Ivoire, Ghana, Gambia, Guinea, Guinea-Bissau, Liberia, Mali, Mauritania, Niger, Nigeria, Senegal, Sierra Leone, and Togo.
The Bronx was the primary borough of settlement for West African immigrants, accounting for more than one-half of the population, or 55,100 residents (Table 3.45), an increase over the prior decade (data not shown). Brooklyn’s West African population also grew significantly, making the borough home to around one-quarter of West African New Yorkers.
Reflecting that most West African immigrants resided in the Bronx, 8 of the top 10 neighborhoods of residence were in the borough (Figure 3.32). These were concentrated in the Western Bronx and included Mount Hope, with 4,900 residents, as well as Concourse, Claremont-Mount Eden, and University Heights-Morris Heights, each with over 3,000 West African immigrants (Table 3.46). Ghana was the top country of origin among West Africans in these neighborhoods, and the only country to rank among the city’s top 20 immigrant populations.
Across the river in Manhattan, Harlem had a West African immigrant population of 4,700, while Brooklyn’s West African population was centered in East New York, numbering 3,700.
Residential Patterns of Arab Immigrants
The number of immigrants from Arab countries rose to 69,500 by 2023 (Table 3.47), a significant increase from a decade prior. Arab countries in this analysis include Algeria, Egypt, Libya, Morocco, Sudan, Tunisia, Western Sahara, Iraq, Jordan, Kuwait, Lebanon, Saudi Arabia, Syria, the United Arab Emirates, and Yemen, but exclude additional countries due to data limitations. The Arab immigrant population was similar in size to the foreign-born population from Trinidad and Tobago, the 10th largest immigrant group in the city.
Arab immigrants had a large presence in Brooklyn, which was home to 29,400 residents or 42 percent of the total, a reflection of significant growth over the decade.
The highest concentration of Arab immigrants was in Southern Brooklyn, from Bay Ridge in the west and extending south through neighborhoods leading to Coney Island (Figure 3.33). Bay Ridge served as a large hub, with 6,000 immigrants from Arab countries, or 9 percent of the city total (Table 3.48). Gravesend was home to 4,900 Arab residents, and there was a sizable Arab population in Bensonhurst, Dyker Heights, and Coney Island.
In Queens, Astoria’s Arab immigrant population numbered 2,900, and there was an Arab presence on the Upper East and West Sides of Manhattan, as well as in New Springville-Willowbrook-Bulls Head-Travis and Great Kills-Eltingville on Staten Island. The Bronx’s growing Arab population was centered around parts of Pelham Parkway-Van Nest, where the area around White Plains Road has become known as “Little Yemen,” due to a concentration of Yemeni and other Arab businesses. As of 2023, however, no Bronx neighborhood had an Arab immigrant population exceeding 1,000 residents.
Summary
While New York City’s total immigrant population of nearly 3.1 million people in 2023 was little changed over the prior decade, beneath this overall stability there were notable shifts in the composition and distribution of the foreign-born across boroughs and neighborhoods. Queens was the borough with the largest foreign-born population at roughly 1.1 million; though there was little change in the size of its overall immigrant population, mirroring the city as a whole, there were substantial shifts at the neighborhood level. Brooklyn, the borough with the second largest immigrant population at just over 900,000, however, experienced declines. The Bronx and Manhattan each had a little less than one-half million immigrant residents. Meanwhile, Staten Island, with the smallest immigrant population numbering 125,100, recorded the only significant growth in foreign-born population since 2013 among the boroughs.
Flushing-Murray Hill, in Northeastern Queens, was the city’s largest immigrant neighborhood, with 95,700 foreign-born residents comprising two-thirds of its population. Five other neighborhoods had immigrant populations of over 60,000: East Flatbush and Gravesend in Brooklyn, Elmhurst and Corona in Queens, and Washington Heights in Manhattan. Combined, these 6 neighborhoods had an immigrant population of 436,000, more than the foreign-born population of the city of San Jose, which has the fifth-largest immigrant population in the United States. Other major immigrant population centers included Sunset Park and Bensonhurst in Brooklyn as well as Jackson Heights and South Ozone Park in Queens, each with between 45,000 and 60,000 immigrant residents. The Bronx neighborhood of University Heights-Morris Heights had the borough’s largest immigrant population, with 42,300 foreign-born residents, while Staten Island’s largest immigration population was in Grasmere-Arrochar-South Beach-Dongan Hills, at 13,200.
The major immigrant hubs—those with the largest foreign-born populations and immigrant concentrations of at least 40 percent—displayed distinct demographic trajectories over the past decade. A few neighborhoods, including Flushing-Murray Hill, Bensonhurst, and South Ozone Park maintained relatively stable immigrant populations over the decade. Many other traditional immigrant enclaves, however, experienced steep declines, most notably Sunset Park, Washington Heights, East Flatbush, Jackson Heights, Elmhurst, Corona, and Chinatown-Two Bridges. Declines in the foreign-born in some neighborhoods have coincided with a significant increase in native-born residents, highlighting shifting demographic and economic patterns within these traditionally immigrant neighborhoods.
As many traditional enclaves have experienced declines in their foreign-born populations, immigrants have dispersed across a wide range of neighborhoods, allowing them to establish a stronger presence in other areas that have emerged as growing immigrant hubs. These included East New York, Coney Island, Gravesend, South Jamaica, Springfield Gardens, Baisley Park, and St. Albans. There were also modest increases in the number of immigrants living in neighborhoods where native-born residents predominated, many of which also had substantial new housing construction, including Long Island City, Bedford-Stuyvesant, Hell’s Kitchen, Harlem, and the Upper East Side of Manhattan. Thus, immigrant population declines in many traditional enclaves have been accompanied by a growing foreign-born presence in an expanding range of neighborhoods throughout the city.
Foreign-born residents comprised nearly one-half of the total population of Queens. The number 7 subway corridor served as an important hub of immigrant life in the borough, with numerous large immigrant neighborhoods situated along its path. This area was a particularly important hub for both Asian and Latin American immigrant groups. The Chinese population of Queens was centered in Flushing-Murray Hill, while Jackson Heights and Elmhurst served as key centers for the Bangladeshi community. Latin American groups, including Mexicans, Ecuadorians, and Colombians, had substantial populations in neighborhoods such as Corona and Elmhurst. While many of these neighborhoods experienced declines in their foreign-born populations, there were new areas of growth in the Southeastern subsection of Queens, including neighborhoods such as Springfield Gardens, Baisley Park, and St. Albans. These areas formed an expanding cluster of immigrant communities, joining established hubs such as South Ozone Park, Richmond Hill, and Jamaica. Southeastern Queens was a major area of settlement for the Guyanese population, as well as for South Asian and non-Hispanic Caribbean groups, including Bangladeshis, Jamaicans, Trinidadians, and Indians.
Brooklyn was the second-largest immigrant borough in the city, with 919,700 foreign-born residents, with immigrants largely concentrated in the Southern, Central, and Eastern parts of the borough. Sunset Park in Western Brooklyn, however, remained a key immigrant hub—home to Brooklyn’s Chinatown—where Chinese immigrants made up nearly one-half of the neighborhood’s foreign-born population. At the same time, Sunset Park experienced the largest decline in foreign-born population of any neighborhood in the city, losing over 13,000 immigrants, while farther along the N and D subway lines, Gravesend and Coney Island in Southern Brooklyn were among the fastest growing immigrant hubs. The Chinese population had a large presence in many Southern Brooklyn neighborhoods, as did immigrants from the former Soviet republics—particularly Ukraine, Russia, and Uzbekistan—in neighborhoods such as Gravesend, Sheepshead Bay, Coney Island, and Brighton Beach. Indeed, Southern Brooklyn was the only subsection outside of Queens to have neighborhoods with immigrant majorities. In Central and Eastern Brooklyn non-Hispanic Caribbean immigrant groups, including Jamaicans, Haitians, and Trinidadians, predominated. While this subsection’s major hub, East Flatbush (the “Little Caribbean”), experienced a decline, East New York had among the largest increases in foreign-born residents of any neighborhood in the city. Other groups, such as Bangladeshis and West Africans, were among those with growing populations in East New York.
The Bronx had a growing immigrant population approaching nearly one-half million and was a key hub for Dominican and other Latin American immigrants, who together comprised over one-half of immigrants in the borough. University Heights-Morris Heights was the single largest immigrant neighborhood in the borough and had a large Dominican community, located right across the Harlem River from the traditional Dominican hub of Washington Heights in Manhattan. Even as the borough continues to be home to substantial Dominican and other Latin American communities, the Bronx’s growing immigrant population is becoming increasingly diverse in origin. A group of neighborhoods along the Grand Concourse and Jerome Avenue in the South and Western Bronx had among the highest concentrations of foreign-born residents in the borough. Within these neighborhoods, West African immigrants, most prominently Ghanaians, had growing populations. Non-Hispanic Caribbean immigrants, especially Jamaicans, had a sizable presence in Northern Bronx neighborhoods such as Wakefield-Woodlawn. In the Eastern Bronx, there was a growing population of Bangladeshi immigrants.
Manhattan was home to 468,100 foreign-born residents, who were primarily from Latin America and Asia, with Europeans making up a large portion of the remainder. The Dominican Republic and China were the top countries of origin, as they were for the city as a whole. The borough’s immigrant composition differed markedly between the Upper and Lower subsections of the borough. In Lower Manhattan, Asians comprised a majority of the foreign-born population, with China by far the largest country of origin. Chinatown-Two Bridges in particular was a leading hub—about one-half of its population was foreign-born, nearly 4-in-5 of whom were born in China. In Upper Manhattan, the Latin American immigrant population predominated, especially those born in the Dominican Republic. Washington Heights and Inwood were the most prominent residential and cultural hubs for the Dominican population, joined by smaller populations of Mexicans and Central and South American groups. However, one trend common to both Upper and Lower Manhattan was the significant decline in immigrant populations in their traditional hubs of Washington Heights and Chinatown, respectively. By contrast, Manhattan’s immigrant population as a whole did not decline, buoyed by growth in neighborhoods such as Hell’s Kitchen, the Upper East Side, Harlem, and Murray Hill-Kips Bay.
Staten Island had the smallest foreign-born population of the five boroughs, totaling 125,100. It was, however, the borough with the most substantial growth in its immigrant population, gaining 28,500 foreign-born residents over the decade, a 30 percent increase. The highest immigrant concentrations in the borough were on the island’s eastern side, near the Verrazzano-Narrows Bridge, where growing numbers of Chinese and other immigrants brought neighborhoods such as Rosebank-Shore Acres-Park Hill and Grasmere-Arrochar-South Beach-Dongan Hills to over one-third foreign-born. The flow of Chinese immigrants exemplifies the constantly changing immigrant residential landscape, including movement from central enclaves to a wider swath of neighborhoods. Over the past decade, New York City’s foreign-born population has followed both established routes and emerging patterns of settlement, continuing to remake the city’s neighborhoods.