
 Department of City Planning311Search all NYC.gov websites


Press Releases
For Immediate Release
November 14, 2023
Contacts:
Casey Berkovitz, Joe Marvilli – press@planning.nyc.gov (212) 720-3471
City Planning’s Online Census Data Tools Updated with New Demographic and Household Information and Ability to Map and Rank Neighborhoods
Population FactFinder and Population MapViewer Now Reflect the Latest Demographic and Housing Characteristics Along with Neighborhood Maps and Rankings
NEW YORK – Department of City Planning (DCP) Director Dan Garodnick today announced that DCP’s Population FactFinder and Population MapViewer tools have been updated with new demographic information and features to make exploring New York’s diverse communities easier than ever.
“The latest additions to Population FactFinder and MapViewer are the next step in our ongoing work to make important demographic information about New York City accessible and transparent to all,” said Dan Garodnick, Director of the Department of City Planning. “Our cutting-edge online tools make it easy to visualize complicated demographic data across New York’s diverse neighborhoods and communities.”
Notable new information from the Census Bureau’s 2020 Census Demographic & Housing Characteristics file includes detailed age, household composition, housing tenure, and vacancy rates. These data are viewable for a host of different geographies including blocks, Neighborhood Tabulation Areas (neighborhoods), Community Districts, and the latest City Council Districts. The data are accompanied by illuminating charts summarizing selected characteristics, like age distributions and the percent rental units. Along with the 2020 Census data, Population FactFinder shows changes since 2010, and continues to incorporate a rich array of the latest socioeconomic data from the American Community Survey.
Key characteristics from the 2020 Census and American Community Survey are also available in Population MapViewer, which allows the public to explore the landscape of characteristics across neighborhoods in maps and ranked charts. As with Population FactFinder, users can explore changes across time, and examine individual neighborhoods vis-à-vis other neighborhoods and the city overall.
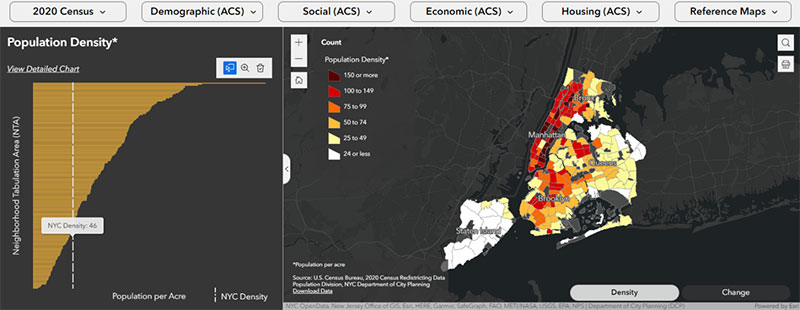
The latest 2020 Census data shows, for example, that Midtown-Times Square is the neighborhood with the lowest average household size at 1.60 people per household; that the Upper East Side-Yorkville is the densest neighborhood in New York City, with 267 people per acre; and that Arden Heights-Rossville is the neighborhood with the lowest percent of renter-occupied households, at 18.6%.
Department of City Planning
The Department of City Planning (DCP) plans for the strategic growth and development of the City through ground-up planning with communities, the development of land use policies and zoning regulations applicable citywide, and its contribution to the preparation of the City’s 10-year Capital Strategy. DCP promotes housing production and affordability, fosters economic development and coordinated investments in infrastructure and services, and supports resilient, sustainable communities across the five boroughs for a more equitable New York City.
In addition, DCP supports the City Planning Commission in its annual review of approximately 450 land use applications for a variety of discretionary approvals. The Department also assists both government agencies and the public by advising on strategic and capital planning and providing policy analysis, technical assistance and data relating to housing, transportation, community facilities, demography, zoning, urban design, waterfront areas and public open space.