
 Department of City Planning311Search all NYC.gov websites


Press Releases
For Immediate Release
August 6, 2015
Contacts:
Rachaele Raynoff - (212) 720-3471
City Planning Launches Updated NYC Census FactFinder Application
Facilitates Custom Geographic Searches Accessing the Latest ACS Socioeconomic Data
August 6, 2015 - The Department of City Planning (DCP) today launched a major update to its online New York City Census FactFinder tool that enables web visitors to create profiles for customized New York City geographies using the latest available socioeconomic and housing data from the American Community Survey (ACS). For this new version, DCP’s Population Division, in collaboration with the Department of Information Technology and Telecommunications (DoITT) , added more comprehensive information and an additional utility that flags whether a search returns statistically meaningful data that can be used for research and service delivery planning. The City’s Census FactFinder application is unique in that no other entity provides free access to complete ACS profiles for custom geographies, including information on data reliability.
City Planning Director Carl Weisbrod said, “If information is power, NYC’s Census FactFinder will help create a new generation of urban superheroes, who harness data to analyze and understand population trends, characteristics and needs of neighborhoods. This application helps users ensure that their search results are reliable for the geographies they select, thus strengthening their analysis and making their work more meaningful and more useful. This technology is an enormous resource for city agencies and for anyone in the public or media who cares about the attributes of New York’s diverse neighborhoods and residents.”
Previously, the online application queried information only from the decennial Census, which in 2010 became more limited to a “short form” survey that included sex, race, ethnicity and housing units. This tool has been widely used by the public, students, government entities, researchers, non-profits, and journalists. NYC Census FactFinder now features in-depth ACS data on demographic, social, economic, and housing characteristics with more frequent (annual) releases. The ability to mine these data greatly enhances the ability of users to assess the needs of specific populations and neighborhoods. This version of the applicationenables users to research information such as household income, places of birth, English language proficiency, commuting patterns, health insurance coverage, vehicle availability, educational attainment, housing values, rent, and much more for customized geographies.
DCP worked with DoITT to develop an interactive mapping application that associates the ACS data to its respective geographies and provides query, selection, and visualization capabilities.
Anne Roest, Commissioner of the Department of Information Technology and Telecommunications, said, “Access to information will ultimately serve to make New York City a better place for its residents. Working with DCP on the Census FactFinder furthers our goal of facilitating greater access to technology to engage all New Yorkers. DoITT is proud to have extended the utility of this application, adding value to an already useful tool for the public, researchers, and City employees.”
To use the application, choose whether you want to profile census tract(s) or a Neighborhood Tabulation Area (NTA). (A NTA is smaller than a community district but larger than a census tract.) After choosing your profile type, a NTA or specific tract(s) can be selected by zooming in on the map or by accessing this information from the side panel. The side panel drop-down menu allows you to search for a location by address, intersection, place of interest, census tract, subway station, or neighborhood. Multiple census tracts can be selected and you can also create a search radius around a location to query.
The selected area will be highlighted in blue.
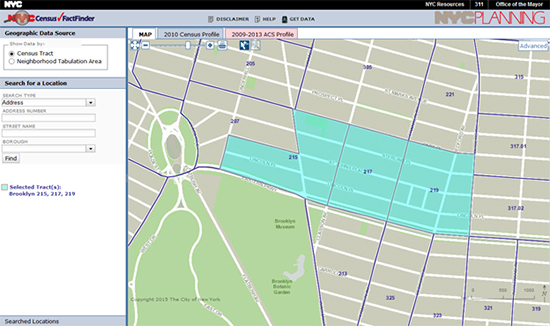
Once a geographic area is selected, you can view the 2010 Census Profile tab for the full demographic profile or see how these data have changed in the selected area over the past decade, from 2000 to 2010. In addition to the content from the decennial censuses, you can now choose the ACS 2009-2013 tab to access four sub-sections: Demographics, Social, Economic, and Housing.
- From the Demographics tab, core statistics like age and race are available
- On the Social tab, explore topics like migration, nativity, language, educational attainment, disability, and ancestry
- The Economic tab provides information on employment, commuting, occupation, income, and health insurance coverage
- Under Housing, find detail on vacancy rates, overcrowding, vehicle availability, housing value, and rent
Along with this wealth of data, you can examine the reliability of individual statistics; unreliable estimates are grayed out. Enlarging the search area can provide more statistically meaningful numbers.
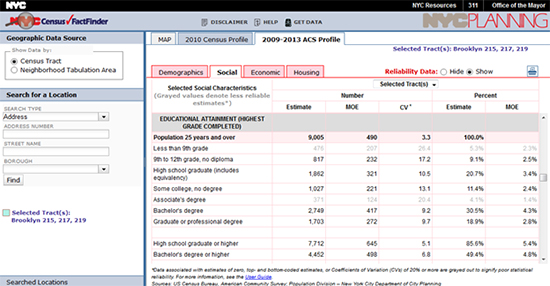
If you change the geography of your query, the results are recalculated on-the-fly with data reliability information displayed for the new geography.
As access to the most up-to-date socioeconomic and housing information is critical to researchers, communities, and decision makers, DCP will regularly update the application to enable users to query the latest ACS releases.
Just last week, DCP also posted a series of maps of selected demographic, socioeconomic, and housing characteristics by Neighborhood Tabulation Area.