


Citywide Overall Crime Continues to Decline in September 2018
October 3, 2018
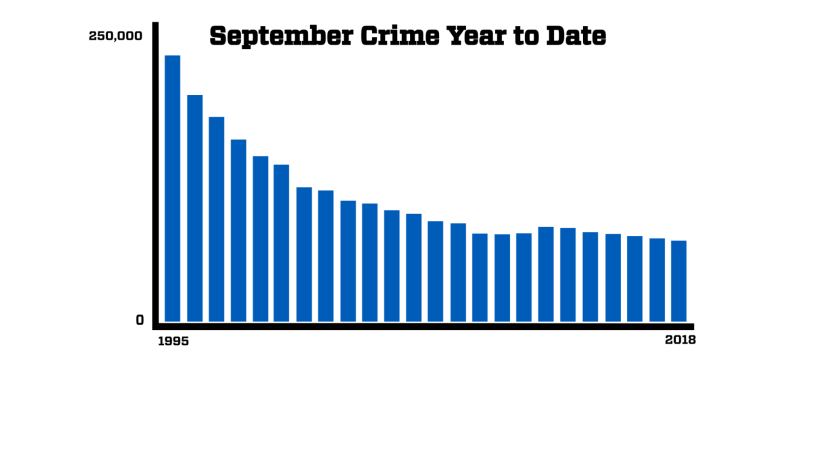
New York City this month experienced fewer major crimes than in September 2017. This is the lowest index-crime year-to-date and for any September in the CompStat era. "Having just come off some major annual events here in New York City – the U.S. Open tennis tournament and the U.N. General Assembly – I want to congratulate all the men and women of the NYPD who showed, yet again, why our police department has a sterling reputation across the world," stated Police Commissioner James P. O'Neill. "From traffic agents to patrol cops, from Intel analysts to counterterrorism experts, the NYPD does a tremendous job of safeguarding all the visitors to our great city, while balancing the absolute need to relentlessly fight crime and keep New Yorkers safe in every neighborhood."
"The men and women of the NYPD work hard every single day to keep our City safe. We will continue to work closely with the community, and use targeted enforcement to continue to drive crime down as we end the year," said Mayor Bill de Blasio.
Key highlights from this month's crime statistics:
- Year-to-date, overall index crimes are down -1% from 2017.
- Robberies, felony assaults, and burglaries continue to be down year-to-date.
- There were 70 shooting incidents this month compared to 79 in September 2017, resulting in a -11.4% decrease and a -4.7% decrease in overall shootings year-to-date
Additionally, in the second quarter of this year there was an increase in homicides, leading to an overall year-to-date increase in homicides (228 vs. 215). There has been a reduction in Q3 from Q2, attributed to:
- Targeting gang violence
- Coordination with Parole and Probation
- Summer All Out
- Increasing Ceasefire areas
- Focusing on domestic violence
- Enhancing gun prosecutions
Homicides by Quarter
| Quarter | 2018 | 2017 |
|---|---|---|
| Q1 | 57 | 66 |
| Q2 | 92 | 70 |
| Q3 | 79 | 79 |
Statistics on Index Crimes 2017-2018
| Sept. 2018 | Sept. 2017 | Change | +/-% | Year-to-Date 2018 | Year-to-Date 2017 | Change | +/-% | |
|---|---|---|---|---|---|---|---|---|
| Murder | 27 | 24 | +3 | +12.5% | 228 | 215 | +13 | +6.0% |
| Rape | 144 | 118 | +26 | +22.0% | 1,348 | 1,053 | +295 | +28.0% |
| Robbery | 1,128 | 1,151 | -23 | -2.0% | 9,574 | 10,292 | -718 | -7.0% |
| Felony Assault |
1,654 | 1,769 | -115 | -6.5% | 15,241 | 15,353 | -112 | -0.7% |
| Burglary | 982 | 1,011 | -29 | -2.9% | 8,639 | 8,873 | -234 | -2.6% |
| Grand Larceny |
3,644 | 3,689 | -45 | -1.2% | 31,968 | 31,976 | -8 | 0.0% |
| G.L.A. | 537 | 499 | +38 | +7.6% | 4,176 | 4,146 | +30 | +0.7% |
| TOTAL | 8,116 | 8,261 | -145 | -1.8% | 71,174 | 71,908 | -734 | -1.0% |
Additional Statistics on Crimes and Shootings 2017-2018
| Sept. 2018 | Sept. 2017 | Change | +/-% | Year-to-Date 2018 | Year-to-Date 2017 | Change | +/-% | |
|---|---|---|---|---|---|---|---|---|
| Transit | 203 | 195 | +8 | +4.1% | 1,777 | 1,772 | +5 | +0.3% |
| Housing | 386 | 418 | -32 | -7.7% | 3,497 | 3,689 | -192 | -5.2% |
| Shooting Incidents |
70 | 79 | -9 | -11.4% | 573 | 601 | -28 | -4.7% |
Note: All crime statistics are preliminary and subject to further analysis, revisions, or change.
Read Chief of Crime Control Strategies Lori Pollock's remarks at the briefing.