
 Food Policy311Search all NYC.gov websites


Supply Gap Analysis
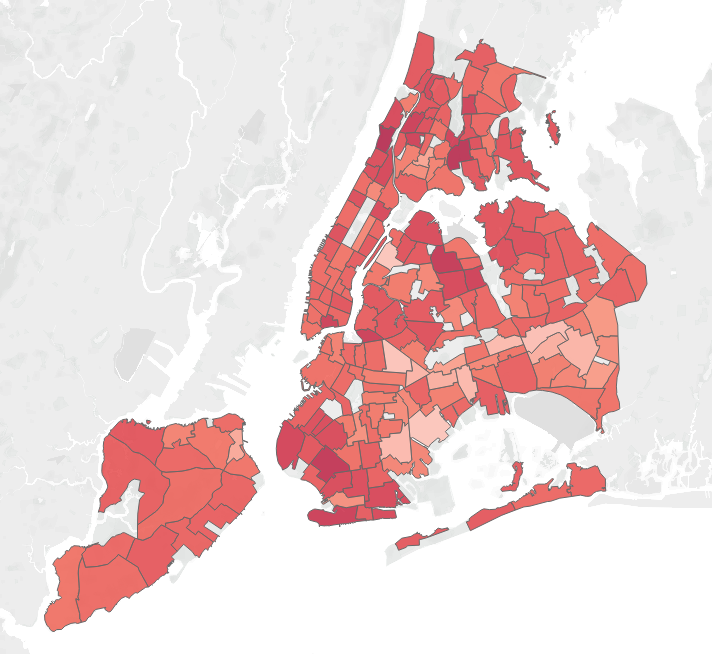
We partnered with emergency food providers to develop the Supply Gap Map, a robust metric that tracks neighborhood-by-neighborhood levels of unmet food need, alongside the various supplies of food going into each neighborhood.
New York City uses this data to inform policymakers and food distributors about where additional food is most needed, how much is needed, and how targeted deliveries could help to close the gap.
Each neighborhood receives a weighted score, on a scale of 1-10, based on its gap between projected need and supply of emergency food. The closer the score is to 10, the higher the level of unmet. On the Supply Gap map, dark shading indicates higher level of need.
View the Supply Gap dataset on NYC Open Data here.
Have questions? Check out the Supply Gap FAQ.
Learn more about how the City leverages the Supply Gap Analysis to support the Community Food Connection program in our 2025 Open Data Week session: