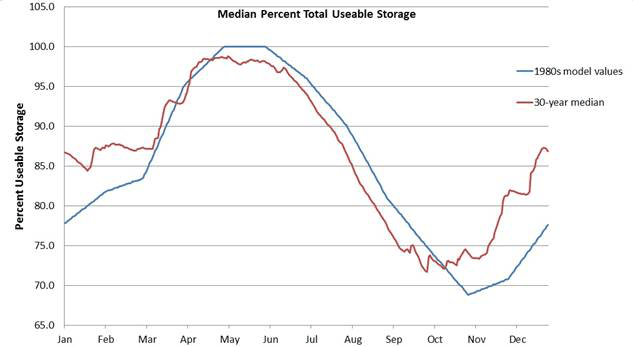
 January 17, 2014 CONTACT: Adam Bosch (845) 334-7868 / Chris Gilbride (718) 595-6600 Department of Environmental Protection Institutes First of its Kind Modeling System for Reservoir ManagementOperations Support Tool Uses Real-Time Data and Advanced Forecasts to Guide Reservoir OperationsReview of Data Leads to New Standard for “Normal” Storage in Reservoir SystemDepartment of Environmental Protection (DEP) Commissioner Carter Strickland today announced that an innovative reservoir management system, known as the Operations Support Tool (OST), has been integrated into the daily operations of New York City’s reservoir system. The OST predicts future storage in the City’s reservoir system by accounting for dozens of variables such as weather forecasts, current demand for water, and myriad changes to the operation of the water supply. The $8 million modeling system will allow DEP to divert or release water from its reservoirs at the most opportune times to help ensure the highest quality drinking water is delivered to more than 9 million New Yorkers, and to benefit downstream communities by enhancing the health of local streams while reducing the risk of flooding. “New York City is breaking new ground with the development of the Operations Support Tool, which is the first modeling system of its kind for any water utility in the country,” Strickland said. “By integrating the best available data into our operational decisions, the OST will help to ensure that we can continue to supply nearly half the state’s population with the highest-quality drinking water while respecting the needs and desires of those that live in and around the watersheds.” The OST incorporates dozens of variables – including real-time data – into the decision making process. Information used by the management system includes: Reservoir operating rules: The capacities of the City’s aqueducts and reservoirs, as well as operating rules related to stream releases and water supply diversions, serve as a foundation for OST. These rules include the Flexible Flow Management Plan for Delaware System reservoirs, the Interim Release Protocol for Ashokan Reservoir, required releases from Croton System reservoirs, and more. This ensures that OST does not yield options that are outside the scope of existing regulations or the water supply system’s capacity. Weather and environmental data: OST uses real-time data from a number of sources, including stream gauges, devices that measure the water content of snowpack throughout the watersheds, and rain gauges, as well as forecasts from the National Weather Service. These data help DEP forecast the amount of water expected to enter the reservoir system, also known as runoff or “inflow,” over a period of time. Runoff forecasting for OST was significantly improved through a partnership with the National Weather Service (NWS). DEP provided up to $1 million to the NWS to expedite its development of the Hydrologic Ensemble Forecast Service (HEFS), a new computer modeling system that uses meteorological forecasts and current snowpack data to predict the amount of runoff from rainfall and snowmelt. Before this new system was developed, DEP used the historic record of rainfall and runoff to predict the impact weather would have on the water supply. The National Weather Service delivers HEFS forecasts to DEP every day, and they are automatically incorporated into OST, which is expected to enhance the accuracy of runoff predictions. “We are excited to provide these improved river forecasts to NYC DEP that support optimized management of the NYC water supply," said Laura Furgione, National Weather Service deputy director. "Through this partnership, we can demonstrate the value of river forecast uncertainty information and begin rolling out probabilistic forecasts at least a year earlier than originally planned that will improve our services to protect lives and property and enhance the national economy. Effective partnerships, like this one with NYC, are critical to our vision for a Weather-Ready Nation.” In-city and upstate demand: The modeling system also incorporates the demand for drinking water in the city and among the more than 70 communities upstate that use water from the city’s water supply system. Along with required releases to rivers, creeks, and streams, demand accounts for “outflow” from the system. Operational changes: OST also allows DEP to test different operational decisions to project how each would affect the water supply system in the months ahead. For instance, if DEP chose to divert 300 million gallons a day from one of its reservoir systems instead of 500 million gallons, OST can project how that decision and dozens of others will affect system storage, water quality, required releases, and more. This advanced modeling allows DEP to test different operational changes in a virtual setting – and understand their outcomes – so that daily decisions are made with the best available information. OST also takes into account how ongoing construction projects might affect the water supply, and it will help DEP make operational changes ahead of big storms to limit turbidity, and the effect of wind and other factors. Because OST reads dozens of data sets that are fed into the system from many sources, the modeling program requires an especially powerful computer system. Development of OST included the installation of computer hardware that uses 64 processing cores to maximize performance. By comparison, the average home computer has roughly six processing cores. Before the new hardware was developed, OST’s most complicated models took 30 hours to produce results. Now, the most complicated model produces results in about 30 minutes. DEP began developing OST with consultant Hazen and Sawyer in 2009 and portions of the system were phased into DEP’s daily water supply operations as they were completed. The OST will continue to be updated in the future to reflect changes to regulations, infrastructure, and other factors affecting water supply operations. Analysis of data used for OST also led DEP to reassess what’s known as “normal” storage in its reservoir system. The “normal” storage is a number that’s updated every day on DEP’s website, and often referred to by news publications and local meteorologists to explain how heat waves, droughts, large storms or other weather events affect storage in the City’s reservoir system. The “normal” storage is listed next to the current day’s storage on a map that can be found by clicking here. The values for “normal” storage were set by engineers sometime in the 1980s, using now-antiquated modeling to create a chart that projected how storage in the reservoirs would generally change during periods of higher demand in the summer, and periods of snowfall and rain in the winter and spring. As part of the development of OST, DEP recently compiled 30 years of reservoir storage data and used their median to reflect the actual “normal” storage for the system. The 30-year median values showed that the City’s 19 reservoirs and three controlled lakes held more water during the fall and early winter than predicted in the 1980s. Several factors likely contribute to this difference, including lower demand for water as a result of high-efficiency fixtures. Also, the data show that the Northeast has experienced a prolonged “wet” period, during which precipitation has been unusually high for the past several decades. Climate change also plays a role through increased incidents of extreme storms, and by melting snow earlier in the calendar year, which leads to the reservoirs refilling earlier. Many of these factors could not have been predicted with the 1980s modeling. “Using these 30 years of data as the standard for normal storage in our reservoir system will give New Yorkers a better understanding of their water supply on a daily basis,” Strickland said. “As we strive to be the most transparent water supply in the country, it’s also important that the information we provide is as accurate as possible. These new data will meet that high standard.” The chart below shows the normal storage as modeled in the 1980s, and the normal storage according to the 30-year median of actual data.
DEP will soon switch to using the new data for normal storage, which will provide City and watershed residents with a more accurate comparison to current storage throughout the reservoir system. DEP manages New York City’s water supply, providing more than one billion gallons of water each day to more than 9 million residents, including 8.3 million in New York City, and residents of Ulster, Orange, Putnam, and Westchester counties. This water comes from the Catskill, Delaware, and Croton watersheds that extend more than 125 miles from the City, and the system comprises 19 reservoirs, three controlled lakes, and numerous tunnels and aqueducts. DEP employs nearly 6,000 employees, including almost 1,000 scientists, engineers, surveyors, watershed maintainers and others professionals in the upstate watershed. In addition to its $68 million payroll and $157 million in annual taxes paid in upstate counties, DEP has invested more than $1.5 billion in watershed protection programs—including partnership organizations such as the Catskill Watershed Corporation and the Watershed Agricultural Council—that support sustainable farming practices, environmentally sensitive economic development, and local economic opportunity. In addition, DEP has a robust capital program with over $14 billion in investments planned over the next 10 years that will create up to 3,000 construction-related jobs per year. For more information, visit www.nyc.gov/dep, like us on Facebook at www.facebook.com/nycwater, or follow us on Twitter at www.twitter.com/nycwater. | ||